This page has been translated automatically.
Video Tutorials
Interface
Essentials
Advanced
How To
Basics
Rendering
Professional (SIM)
UnigineEditor
Interface Overview
Assets Workflow
Version Control
Settings and Preferences
Working With Projects
Adjusting Node Parameters
Setting Up Materials
Setting Up Properties
Lighting
Sandworm
Using Editor Tools for Specific Tasks
Extending Editor Functionality
Built-in Node Types
Nodes
Objects
Effects
Decals
Light Sources
Geodetics
World Nodes
Sound Objects
Pathfinding Objects
Players
Programming
Fundamentals
Setting Up Development Environment
Usage Examples
C++
C#
UnigineScript
UUSL (Unified UNIGINE Shader Language)
Plugins
File Formats
Materials and Shaders
Rebuilding the Engine Tools
GUI
Double Precision Coordinates
API
Animations-Related Classes
Containers
Common Functionality
Controls-Related Classes
Engine-Related Classes
Filesystem Functionality
GUI-Related Classes
Math Functionality
Node-Related Classes
Objects-Related Classes
Networking Functionality
Pathfinding-Related Classes
Physics-Related Classes
Plugins-Related Classes
IG Plugin
CIGIConnector Plugin
Rendering-Related Classes
VR-Related Classes
Content Creation
Content Optimization
Materials
Material Nodes Library
Miscellaneous
Input
Math
Matrix
Textures
Art Samples
Tutorials

Debugging IG Application

The debug mode allows inspecting the IG application at run-time. In this mode you can use various console commands to obtain corresponding visual information.
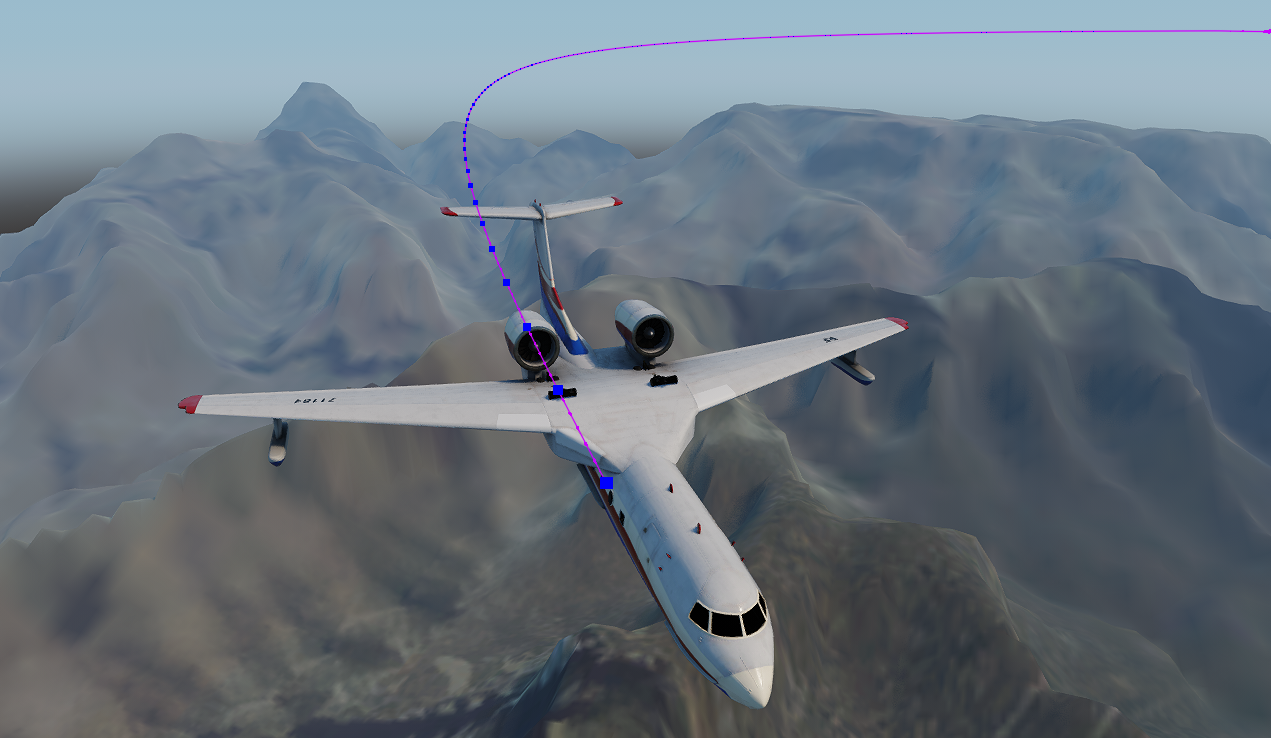
Path Tracing mode enabled

To enable the Debug mode, open the built-in console (use the F1 key) and type ig_debug 1.

Console Commands#

Visualization of debugging information.

ig_debug
Description:
  • Variable.   Prints a value indicating if the option controlled by the command below is enabled.
  • Command.   Toggles the debug mode.
Arguments:
0 - disabled
1 - enabled
ig_debug_requests
Description:
  • Variable.   Prints a value indicating if the option controlled by the command below is enabled.
  • Command.  

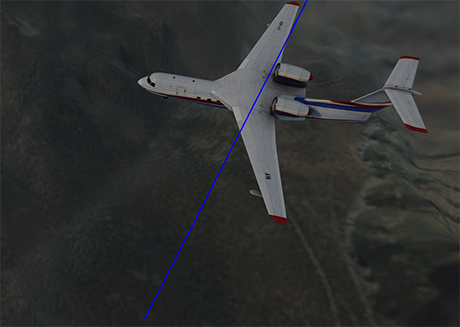
    Toggles visualization of where LOS/HAT/HOT requests are sent to.

Arguments:
0 - disabled
1 - enabled
ig_debug_pathtrace
Description:
  • Variable.   Prints a value indicating if the option controlled by the command below is enabled.
  • Command.  

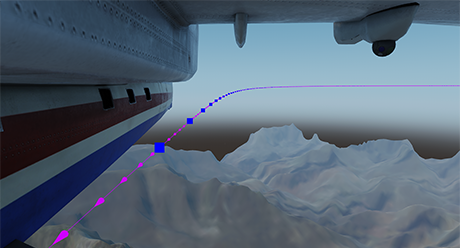
    Toggles tracing of the entity path — the position between frames and data sent over the network. Blue points mark data from the server; pink arrows — movement between frames.

Arguments:
0 - disabled
1 - enabled
ig_debug_collision_segment
Description:
  • Variable.   Prints a value indicating if the option controlled by the command below is enabled.
  • Command.  

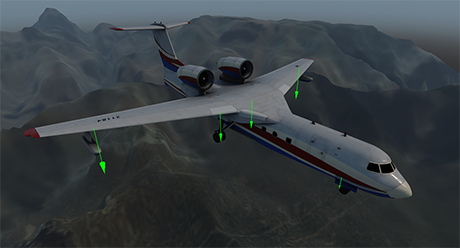
    Toggles visualization of collision segments for every entity.

Arguments:
0 - disabled
1 - enabled
ig_debug_collision_volume
Description:
  • Variable.   Prints a value indicating if the option controlled by the command below is enabled.
  • Command.  

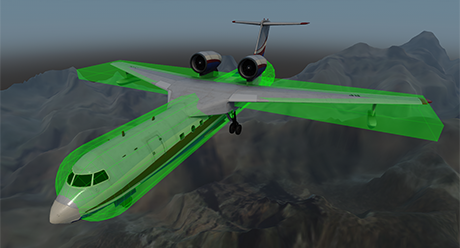
    Toggles visualization of collision volumes for every entity.

Arguments:
0 - disabled
1 - enabled
ig_debug_entity_info
Description:
  • Variable.   Prints a value indicating if the option controlled by the command below is enabled.
  • Command.  

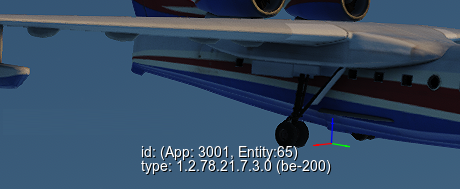
    Toggles visualization of the basis for every CIGI and DIS entity with the ID, type, and type name specified (information is taken from the IG configuration file).

Arguments:
0 - disabled
1 - enabled
ig_debug_interpolation
Description:
  • Variable.   Prints a value indicating if the option controlled by the command below is enabled.
  • Command.  

    Toggles visualization of the interpolation timer parameters and states on the screen.

Arguments:
0 - disabled
1 - enabled
ig_debug_switch_entity
Description:
Switches the current camera to another entity. This command can be used for DIS debugging as such functionality is not supported natively.
ig_debug_visualizer_depth
Description:
  • Variable.   Prints a value indicating if the option controlled by the command below is enabled.
  • Command.   Toggles depth testing for Debug visualizer elements (if elements should be obscured by the ones closer to the camera).
Arguments:
0 - disabled
1 - enabled
ig_debug_visualizer_depth_test
Description:
  • Variable.   Prints the current depth testing mode for Debug visualizer elements. This mode defines the way hidden (obscured by geometry) lines and points are drawn (can help understand their real position in screen captures).
  • Command.   Sets the depth testing mode for Debug visualizer elements. This mode defines the way hidden (obscured by geometry) lines and points are drawn (can help understand their real position in screen captures).
Arguments:
0 - 0 — depth testing is disabled (hidden lines are drawn as visible ones)
1 - 1 — hidden lines are not displayed at all
2 - 2 — hidden lines are drawn dashed/pattern (by default)
ig_debug_visualizer_duration
Description:
  • Command. Sets the visualization time period (in seconds).
Arguments:
10.0 — default
ig_debug_visualizer_scale
Description:
  • Command. Sets the scale used when rendering Debug visualizer elements.
Arguments:
1.0 — default
ig_debug_visualizer_screenspace
Description:
  • Variable.   Prints the current type of dimensions used when rendering Debug visualizer elements:
  • Command.   Sets the type of dimensions used when rendering Debug visualizer elements:
Arguments:
0 - false — use the world space dimensions (by default)
1 - true — use the screen space dimensions
ig_debug_visualizer_pixelsize
Description:
  • Variable.   Prints the current size of visualizer lines in pixels (screenspace mode only).
  • Command.   Sets the size of visualizer lines in pixels (screenspace mode only).
Arguments:
[0; inf] - available range
3 - by default
ig_debug_visualizer_worldsize
Description:
  • Variable.   Prints the current size of visualizer lines in meters (worldspace mode only).
  • Command.   Sets the size of visualizer lines in meters (worldspace mode only).
Arguments:
[0; inf] - available range
0.5 - by default
ig_state_save
Description:
Saves the current IG state to the specified file. The state can be used to simplify localization of problems occurring for specific settings or conditions (e.g. save a state and submit it to technical support engineer).
Arguments:
Path to the file to save the IG state to.
ig_state_load
Description:
Loads IG state from the specified file and applies it. The state can be used to simplify localization of problems occurring for specific settings or conditions (e.g. save a state and submit it to technical support engineer).
Arguments:
Path to the file to load the IG state from.

A set of console commands controlling interpolation and extrapolation. These commands should be used on Master.

ig_interpolation_enable
Description:
  • Variable.   Prints a value indicating if the option controlled by the command below is enabled.
  • Command.   Toggles interpolation.
Arguments:
0 - disabled
1 - enabled
ig_interpolation_period
Description:
  • Command. Sets the interpolation time period.
Arguments:
0.2 — default
ig_extrapolation_period
Description:
  • Command. Sets the extrapolation time period.
Arguments:
0.0 — default

Debug Options#

Free-Flying Camera#

In the Debug mode, you can switch to the free-flying camera.

  • F — switching to a free-flying camera.
  • G — switching back to the entity camera.
Last update: 2024-12-13
Build: ()