Microprofile
 UNIGINE支持Microprofile,这是一种先进的外部可嵌入CPU / GPU分析器,支持逐帧检查。
Microprofile工具探查器具有以下特点:
- 引擎在CPU和GPU上执行的分析操作
- 分析引擎线程
- 最多分析1000帧
- 性能数据输出到本地Web服务器或HTML文件
运行Microprofile#
Microprofile工具仅适用于UNIGINE引擎的Development版本:不会针对Debug和Release版本进行编译。您可以使用 microprofile_info 控制台命令来检查Microprofile是否已编译。
Microprofile可以输出到本地Web服务器或HTML文件。
Microprofile仅在渲染前 1000 帧后显示有效信息(例如,在60帧/秒的帧率下,这种“预热”时间约为16秒)。启用和禁用Microprofile#
Microprofile消耗性能,这就是为什么我们建议您仅在使用时启用它,否则保持禁用。
禁用Microprofile的一种方法是在运行UnigineEditor或应用程序之前取消选中相应的选项:

另一种方法是使用microprofile_enabled控制台命令。
如果通过控制台更改Microprofile状态,则此设置将保存在<Project_Name>/data/configs/default.user文件中。 用户配置文件中设置的状态将复盖通过SDK浏览器定义的状态。将性能数据保存到文件#
Microprofile允许将性能数据保存到HTML文件,然后离线分析。
要将性能数据输出到HTML文件,请执行以下操作:
- 在控制台中,通过microprofile_dump_frames控制台命令设置要分析的帧数。 您可以跳过此步骤:默认情况下,将对500帧进行分析。
- 运行microprofile_dump_html控制台命令。
性能数据将保存到指定的HTML文件中。
如果未指定路径,则转储将保存到data/microprofile_dump_html文件夹。使用分析转储简化了捕获性能“峰值”:引擎在后台继续呈现应用程序,即使它不在焦点上,因此在使用Web服务器进行性能数据可视化的情况下,可以覆盖发生峰值的帧。它还可以用来估计优化结果:您可以转储优化前后的帧并对它们进行比较。
使用内置服务器进行可视化#
要使用本地Web服务器可视化性能数据,请执行以下操作:
- 在控制台中,通过 microprofile_webserver_frames 控制台命令设置要分析的帧数。您可以跳过此步骤:默认情况下,将分析 200 个帧。
-
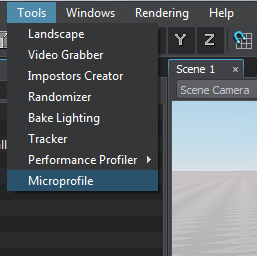
在UnigineEditor的菜单栏上,选择Tools -> Microprofile。
性能数据将显示在您的Web浏览器中。
- 您只能显示部分分析帧:在Web浏览器地址栏中,将/<number_of_frames>添加到当前URL。
- 在收集分析数据时,不要忘记在Web浏览器中刷新页面(F5),因为它不是自动执行的。
例如,如果指定localhost:1337/100,则仅显示前100帧。
性能数据#
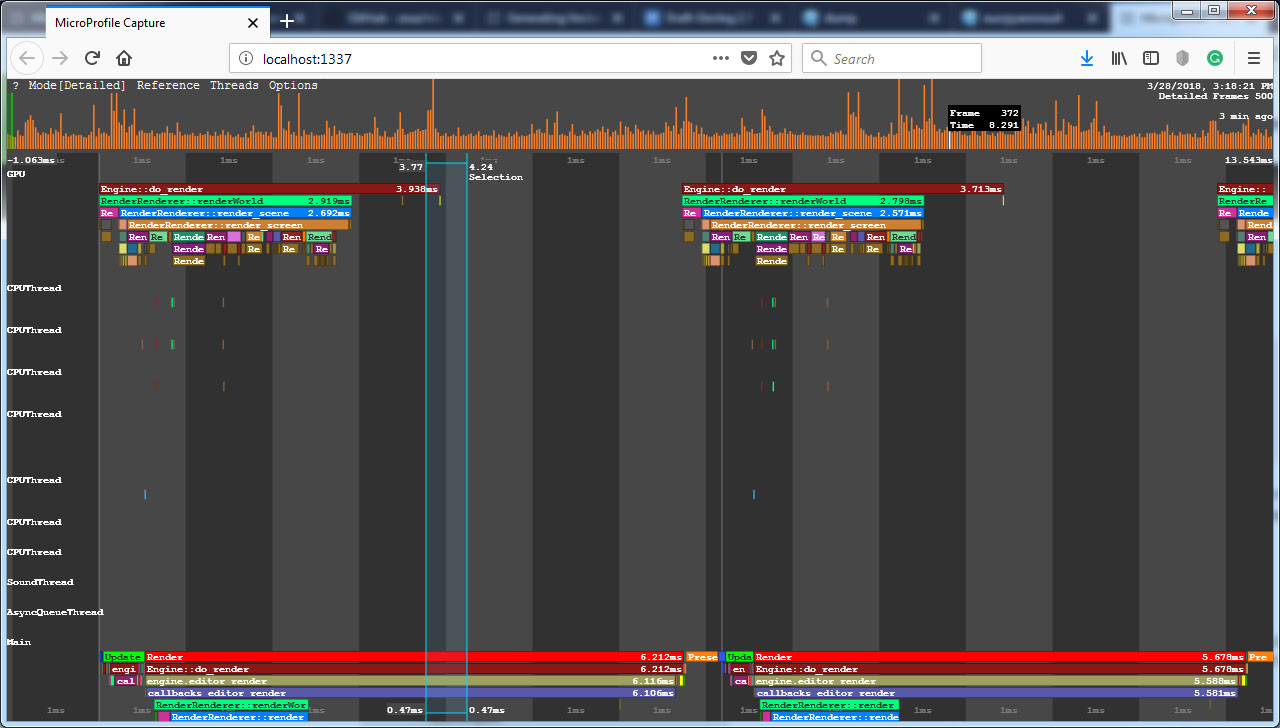
Microprofile可视化引擎在CPU和GPU 以及引擎线程上执行的操作的每帧详细性能数据。在Microprofile主菜单中,您可以更改可视化模式:单击Mode并选择所需的模式。默认情况下,设置为Detailed模式。
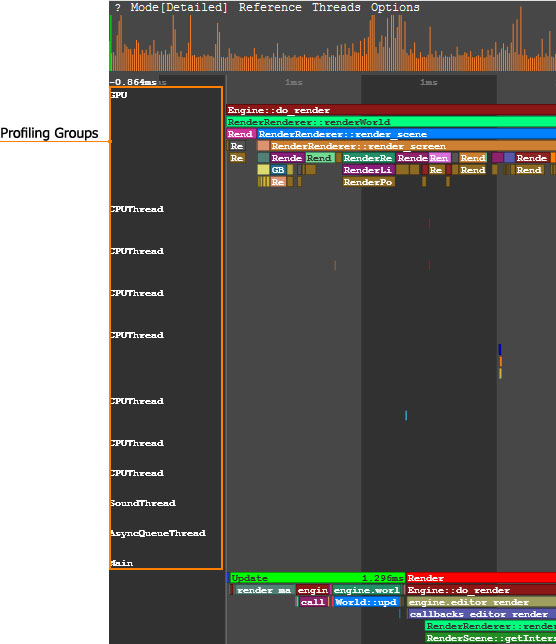
以Detailed模式显示的性能分析组在Detailed模式下,每个操作(功能)和线程均显示为单独的彩色区域。区域是分层的:另一个功能调用的功能显示在最后一个功能下方。区域的大小取决于相应操作所花费的时间。
在下图中,Engine::do_render()函数调用RenderRenderer::renderWorld()函数,依此类推:
要在某个操作或线程上查看数据,请指向相应的区域。要放大/缩小显示的区域,请滚动鼠标滚轮。
CPU数据#
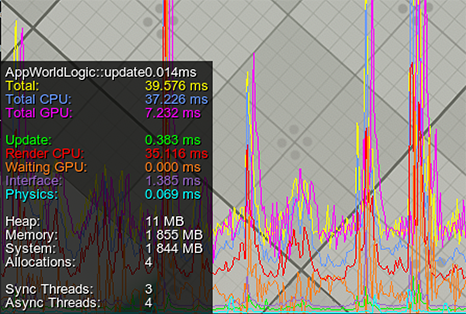
在性能数据的Main组中,显示引擎在CPU上执行的操作的调用堆栈(例如update, rendering等)。
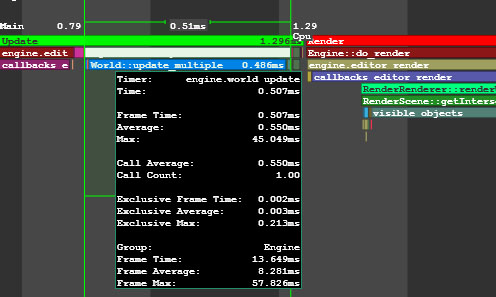
World Update函数的性能数据GPU数据#
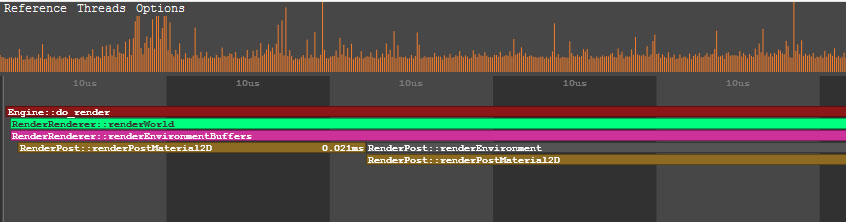
性能数据的 GPU 组中,显示了引擎在GPU上执行的操作的调用堆栈。除了主要性能数据以外,对于每个功能(例如环境渲染,后期材质渲染等),还会显示DIP调用和渲染的三角形的数量。还可以有此功能渲染的表面,灯光,阴影的数量,所使用的材质和着色器的数量。有关调用该函数的节点或材质的信息(标识符,名称等)。
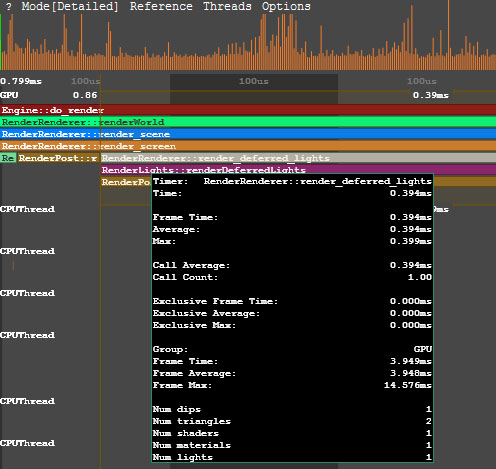
延迟照明渲染上的性能数据
指向与某个功能对应的区域时,将在CPU上调用此功能以及执行该功能所花费的时间时显示Microprofile。
Vulkan或DirectX命令可以组合到在定义概要分析范围时自动创建的GPU调试组。从外部文件加载的所有图形资源(例如纹理,着色器,静态或蒙皮的网格物体)以及引擎的内部资源均具有自己的调试名称,以简化识别。使用Graphics API调试器(例如NVIDIA Nsight或RenderDoc)时,此信息可能很有用。
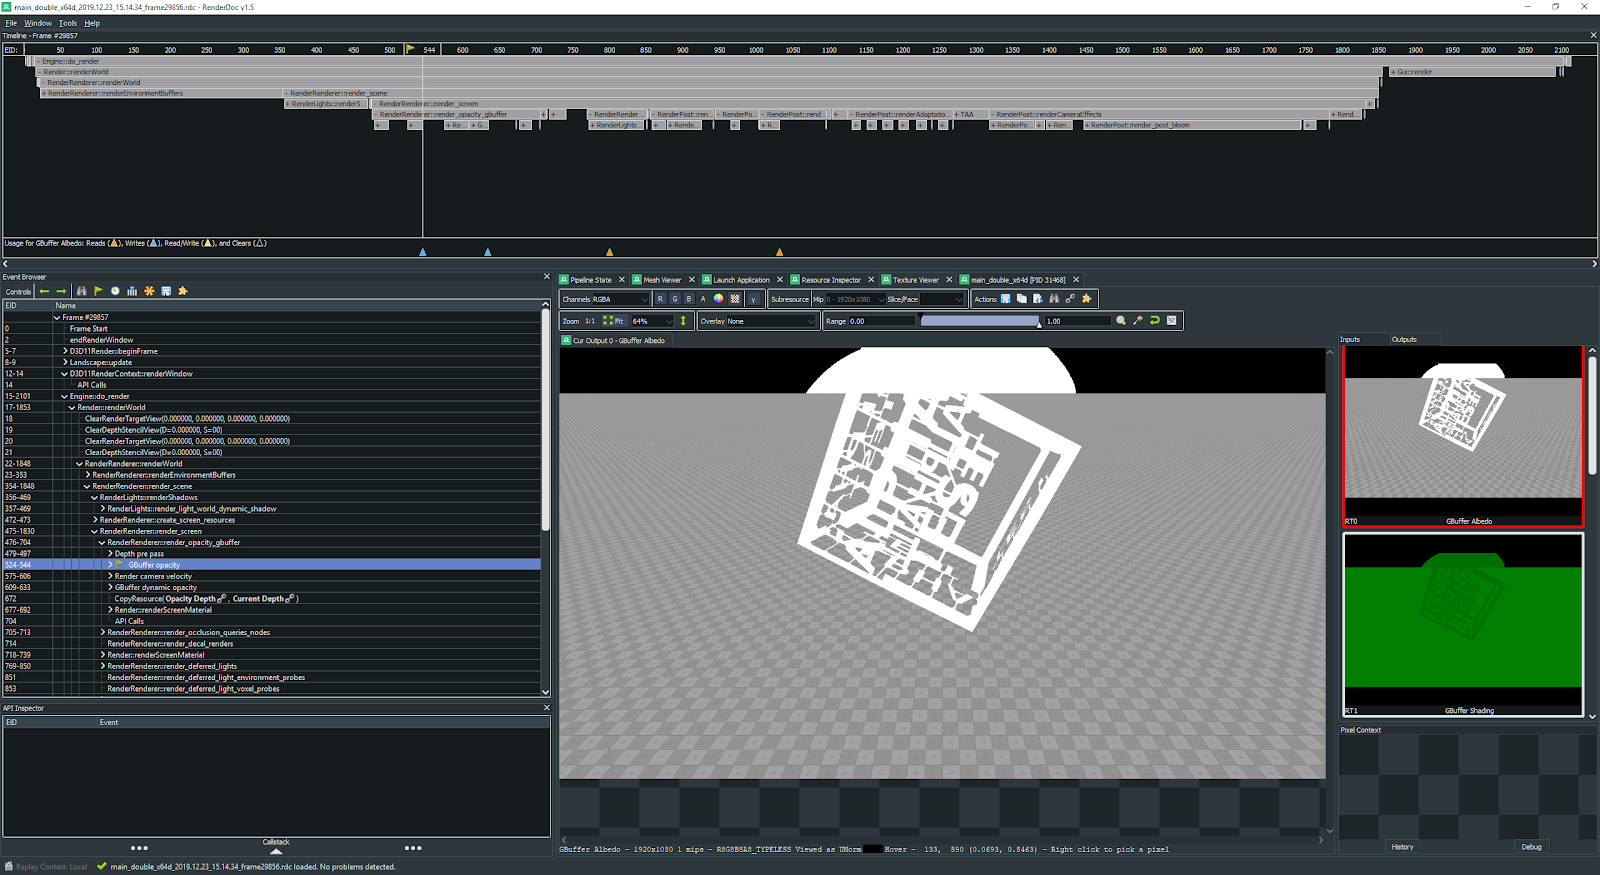
在RenderDoc中查看的调试数据示例引擎线程数据#
引擎线程上的性能数据在CPUThread, SoundThread, AsyncQueueThread, WorldSpawnMeshClutterThread, WorldSpawnGrassThread组中可视化。
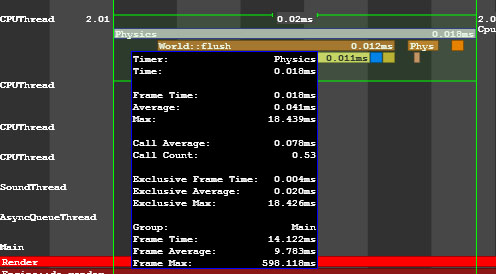
物理线程上的性能数据将Microprofile用于应用逻辑#
您可以使用Microprofile来检查应用程序逻辑的性能。
- 打开应用程序的源代码。
- 包含UnigineProfiler.h文件以访问Profiler类的方法。AppWorldLogic.h
#include <UnigineProfiler.h> using namespace Unigine; - 在要检查的代码中查找函数或作用域。
-
在函数(或作用域)的开头,调用Profiler::begin()。 指定要在Microprofile中显示的捕获的名称。注意您可以指定__FUNCTION__宏以自动使用类和函数名作为捕获。
-
在函数(作用域)的末尾,调用Profiler::end()。AppWorldLogic.cpp
int AppWorldLogic::update() { // start profiling Profiler::begin("AppWorldLogic::update"); float time = Game::getTime(); float angle_0 = time * 1.0f; float angle_1 = time * 1.5f; float angle_2 = time * 2.0f; light_0->setWorldTransform(translate(Unigine::Math::Vec3(sinf(angle_0), cosf(angle_0), 1.0f) * 20.0f)); light_1->setWorldTransform(translate(Unigine::Math::Vec3(sinf(angle_1), cosf(angle_1), 1.0f) * 20.0f)); light_2->setWorldTransform(translate(Unigine::Math::Vec3(sinf(angle_2), cosf(angle_2), 1.0f) * 20.0f)); // stop profiling Profiler::end(); return 1; } - 运行项目。
- 打开控制台并运行microprofile_enabled 1命令。
- 转到Microprofile并找到具有指定名称的区域。
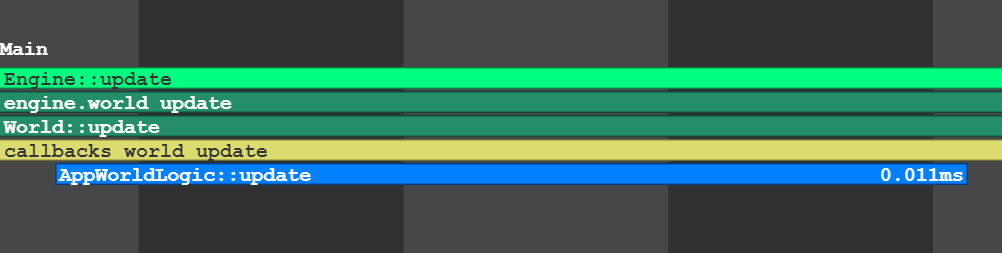
begin()和end()函数使分析作用域可用于分析器和Microprofile。
如果您只想使用Microprofile,请通过beginMicro()和endMicro()函数创建计数器。
beginMicro()返回应传递给endMicro()的标识符。 因此,可以创建多个嵌套计数器。int AppWorldLogic::update()
{
// start profiling
int id = Profiler::beginMicro("AppWorldLogic::update");
float time = Game::getTime();
float angle_0 = time * 1.0f;
float angle_1 = time * 1.5f;
float angle_2 = time * 2.0f;
light_0->setWorldTransform(translate(Unigine::Math::Vec3(sinf(angle_0), cosf(angle_0), 1.0f) * 20.0f));
light_1->setWorldTransform(translate(Unigine::Math::Vec3(sinf(angle_1), cosf(angle_1), 1.0f) * 20.0f));
light_2->setWorldTransform(translate(Unigine::Math::Vec3(sinf(angle_2), cosf(angle_2), 1.0f) * 20.0f));
// stop profiling
Profiler::endMicro(id);
return 1;
}创建用于分析的嵌套计数器#
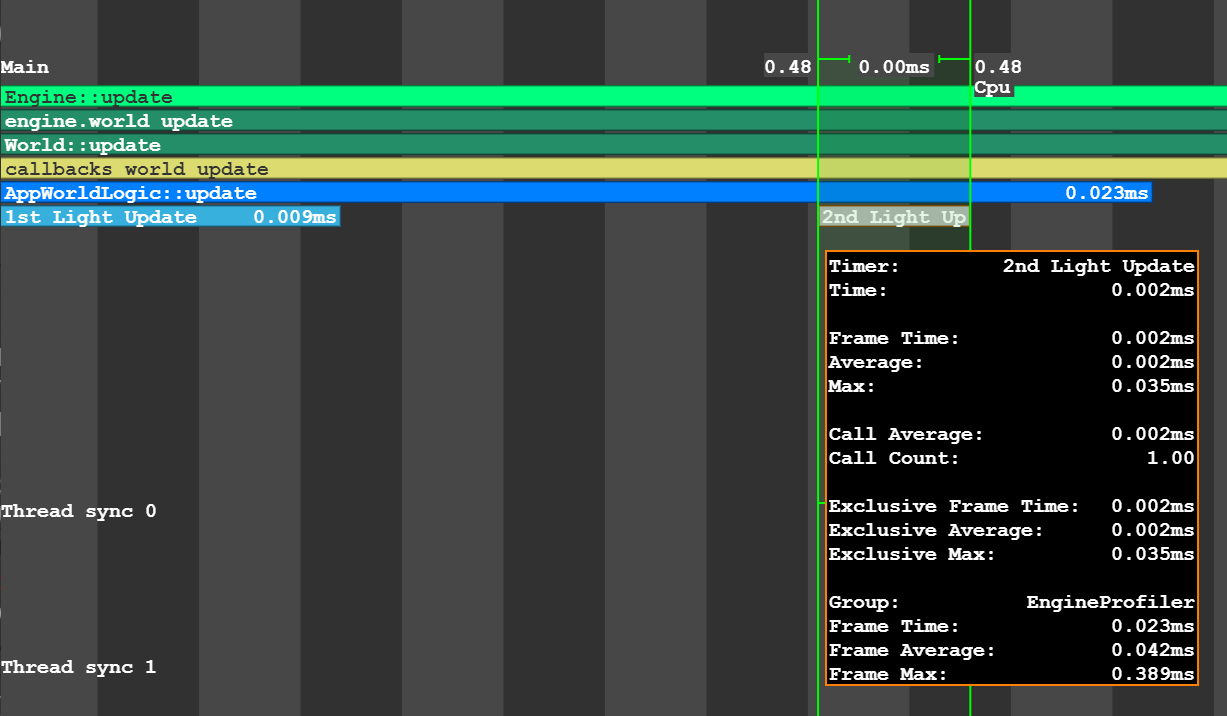
要创建多个嵌套计数器,应使用beginMicro()和endMicro()函数。 beginMicro()返回应传递给endMicro()的标识符。 这样就可以创建嵌套和相交的分析器计数器。
在以下示例中,使用begin()/end()和beginMicro()/endMicro()的组合。 因此,AppWorldLogic::update()函数的分析将在分析器和Microprofile中都可用。
int AppWorldLogic::update()
{

	// start profiling
	Profiler::begin("AppWorldLogic::update");

	float time = Game::getTime();
	float angle_0 = time * 1.0f;
	float angle_1 = time * 1.5f;
	float angle_2 = time * 2.0f;

	// start profiling of the first light source (available in the Microprofile only)
	int id_0 = Profiler::beginMicro("1st Light Update");

	light_0->setWorldTransform(translate(Unigine::Math::Vec3(sinf(angle_0), cosf(angle_0), 1.0f) * 20.0f));

	// stop profiling of the first light source
	Profiler::endMicro(id_0);

	// start profiling of the second light source (available in the Microprofile only)
	int id_1 = Profiler::beginMicro("2nd Light Update");

	light_1->setWorldTransform(translate(Unigine::Math::Vec3(sinf(angle_1), cosf(angle_1), 1.0f) * 20.0f));

	// stop profiling of the second light source
	Profiler::endMicro(id_1);

	light_2->setWorldTransform(translate(Unigine::Math::Vec3(sinf(angle_2), cosf(angle_2), 1.0f) * 20.0f));

	// stop profiling
	Profiler::end();

	return 1;
}
如果您不需要分析器工具,请仅使用beginMicro()/endMicro()。使用宏分析逻辑#
有特殊的宏来标记应该检查的代码片段。 它们可以用来代替beginMicro()和endMicro()函数:
-
UNIGINE_PROFILER_FUNCTION检查功能的性能。
Using Macro Using Functions 源代码 (C++)void myFunction() { UNIGINE_PROFILER_FUNCTION; // your function code }源代码 (C++)void myFunction() { int id = Profiler::beginMicro(__FUNCTION__); // your function code Profiler::endMicro(id); } -
UNIGINE_PROFILER_SCOPED只检查代码的某一部分。
Using Macro Using Functions 源代码 (C++)void myFunction() { // your function code { UNIGINE_PROFILER_SCOPED("Scope name"); // your function code } }源代码 (C++)void myFunction() { // your function code { int id = Profiler::beginMicro("Scope name"); // your function code Profiler::endMicro(id); } }
视频教程:使用Microprofile进行性能检查#
本页面上的信息适用于 UNIGINE 2.19.1 SDK.