Microprofile
UNIGINE has support for Microprofile, an advanced external embeddable CPU/GPU profiler with support for per-frame inspection.
The profiler features the following:
- Profiling operations performed by the engine on CPU and GPU
- Profiling the engine threads
- Profiling up to 1000 frames
- The performance data output to a local web server or to an HTML file
Running Microprofile#
The Microprofile tool is available only for the Development builds of UNIGINE Engine: it won't be compiled for the Debug and Release ones. You can use the microprofile_info console command to check if the Microprofile is compiled.
The performance data obtained by the Microprofile can be output to a local web server or to an HTML file.
Enabling and Disabling Microprofile#
Microprofile is performance-consuming, that's why we recommend you to enable it only when you work with it and keep disabled otherwise.
One way to disable Microprofile is to untick the corresponding option before running UnigineEditor or the application:
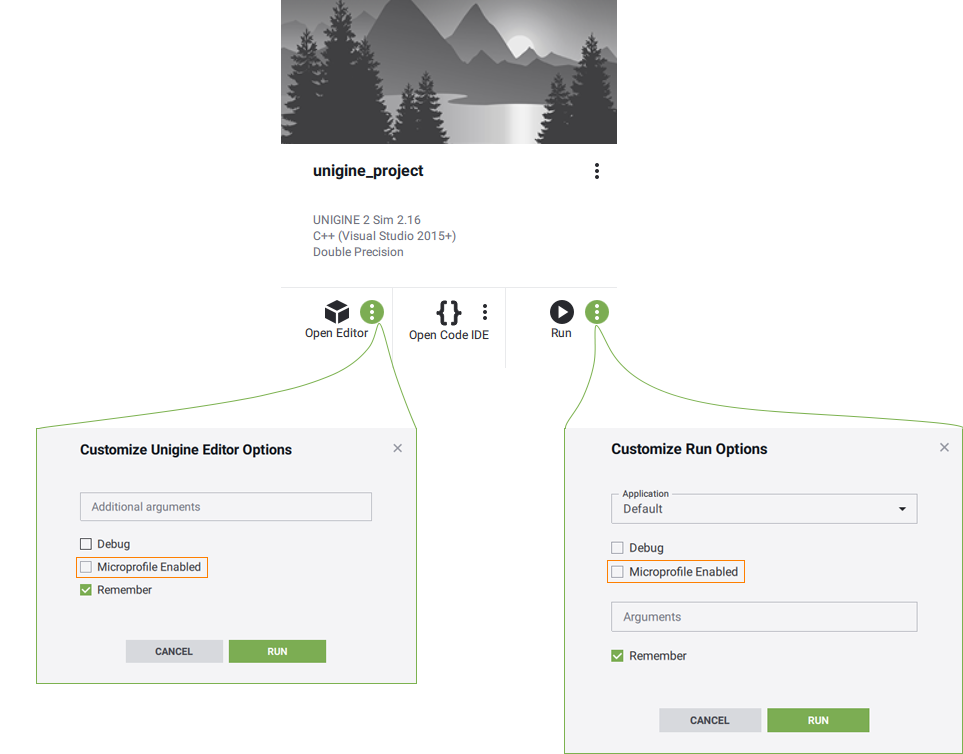
Another way is to use the microprofile_enabled console command.
Saving Performance Data to File#
Microprofile allows saving the performance data to an HTML file and then analyzing it offline.
To output the performance data to the HTML file, perform the following:
- In the console, set the the number of frames to be profiled via the microprofile_dump_frames console command. You can skip this step: by default, 500 frames will be profiled.
- Run the microprofile_dump_html console command.
The performance data will be saved to the specified HTML file.
Using profiling dumps simplifies capturing performance "spikes": the engine continues rendering the application in the background even when it is out of focus, so the frame where the spike has occurred can be overwritten in case of using the Web server for performance data visualization. Also it can be used to estimate the optimization results: you can dump frames before and after optimization and compare them.
Visualization Using Built-In Server#
To visualize the performance data using the local web server, do the following:
- In the console, check the current state of Microprofile using the microprofile_info console command. The displayed web server port is required for data visualization. Adjust the number of frames, if required.
-
In the Web browser address bar, type localhost:1337 (number is the web server port, provided in the info).
You can display only a part of the profiled frames: add /<number_of_frames> to the current URL. For example, if you specify localhost:1337/100, only the first 100 frames will be displayed.
In the Editor, Microprofile is also accessible via the toolbar (Tools -> Microprofile):
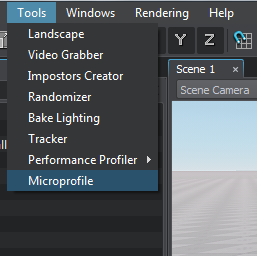
The performance data will be displayed in your Web browser.
All console commands related to performance profiling are available here.
Performance Data#
The Microprofile visualizes the detailed per frame performance data on the operations performed by the engine on CPU and GPU and on the engine threads. In the Microprofile main menu, you can change the visualization mode: click Mode and choose the required one. By default, the Detailed mode is set.
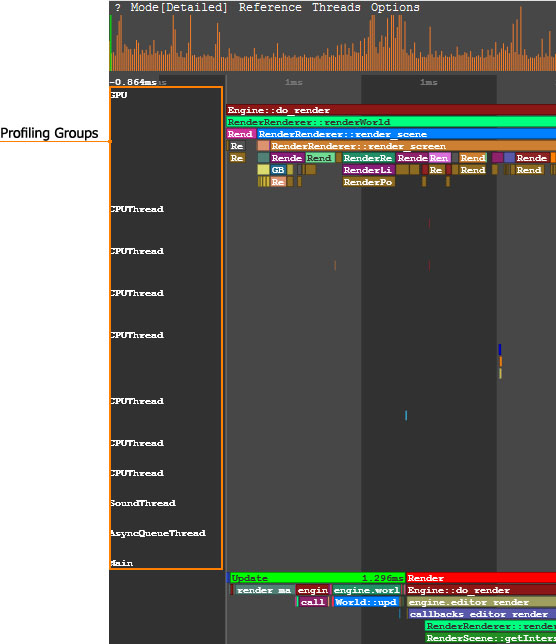
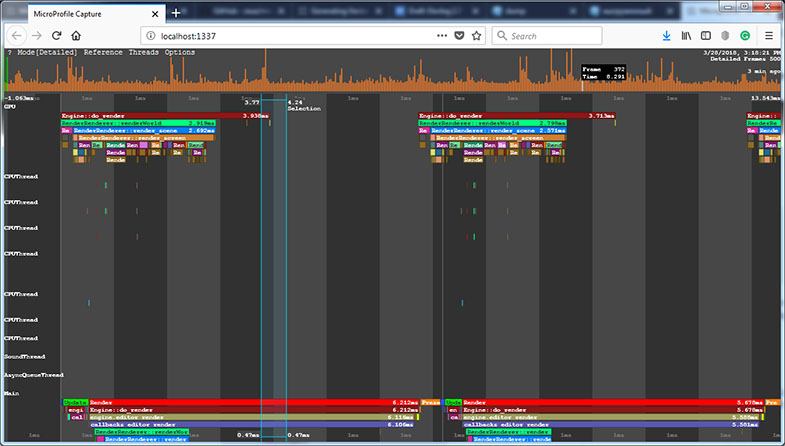
In the Detailed mode, each operation (function) and thread is displayed as a separate colored region. The regions are hierarchical: the function called by the other function is displayed under the last one. The size of the region is determined by the time the corresponding operation takes.
In the picture below, the Engine::do_render() function calls the RenderRenderer::renderWorld() functions and so on:

To view the data on a certain operation or a thread, point to the corresponding region. To zoom in/out the displayed regions, scroll the mouse wheel.
CPU Data#
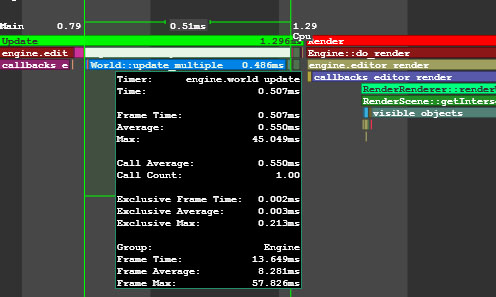
In the Main group of the performance data, the call stack of the operations (e.g., update, rendering, etc.) performed by the engine on CPU is displayed.
GPU Data#
In the GPU group of the performance data, the call stack of the operations performed by the engine on GPU is displayed. In addition to the main performance data, for each function (e.g. environment rendering, post materials rendering and so on), the number of DIP calls and rendered triangles is shown. Also there can be the number of surfaces, lights, shadows rendered by this function, the number of materials and shaders used; the information on the node or material for which the function is called (identifier, name, etc.).
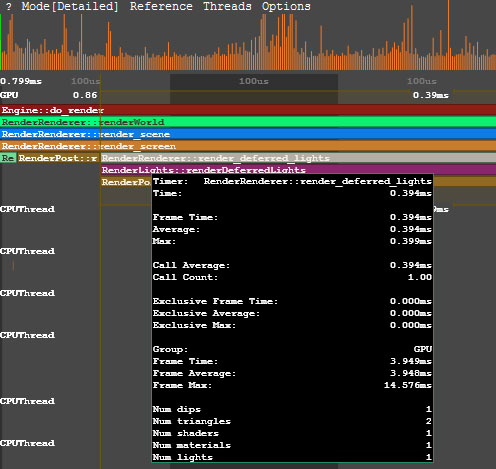
When the region that corresponds to the certain function is pointed, the Microprofile displays when this function is called on CPU and how much time is spent on its performing.
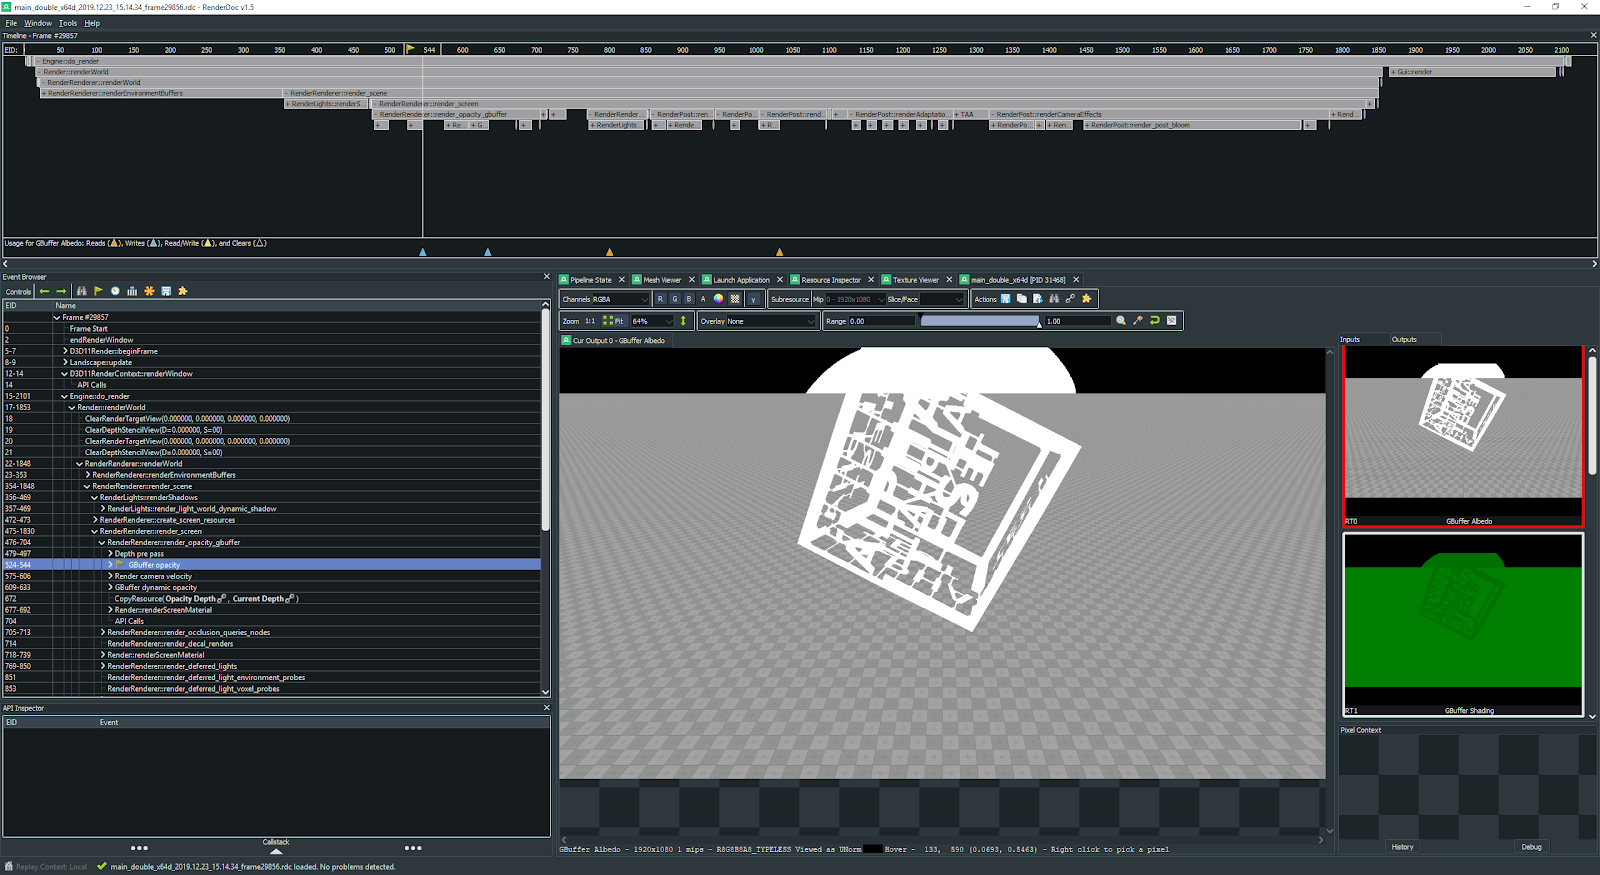
Vulkan or DirectX commands can be combined into GPU Debug groups that are created automatically when defining a profiling scope. All graphic resources loaded from external files, such as textures, shaders, static or skinned meshes, as well as the Engine's internal resources, have their own debug names to simplify identification. This information can be useful when using Graphics API debuggers, such as NVIDIA Nsight or RenderDoc.
Engine Threads Data#
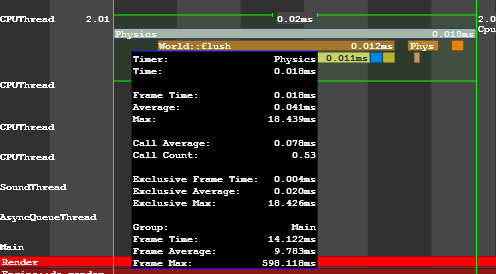
The performance data on the engine threads is visualized in the CPUThread, SoundThread, AsyncQueueThread, WorldSpawnMeshClutterThread, WorldSpawnGrassThread groups.
Using Microprofile For Application Logic#
You can use the Microprofile to inspect performance of your application logic.
- Open the source code of your application.
- Find a function or a scope in the code you want to inspect.
-
In the beginning of the function (or the scope), call Profiler.Begin(). Specify a name for the capture to be displayed in the Microprofile.
NoticeYou can specify the __FUNCTION__ macro to automatically use the class and the function name as the capture. -
In the end of the function, call Profiler.End().
Microprofile.csprivate void Update() { // start profiling Profiler.Begin("Component Update"); float time = Game.Time; Vec3 pos = new Vec3(MathLib.Sin(time) * RADIUS, MathLib.Cos(time) * RADIUS, 0.0f); trigger.Enabled = pos.x > 0.0f || pos.y > 0.0f; trigger.WorldPosition = pos; // stop profiling Profiler.End(); } - Run the project.
- Open the console and run the microprofile_enabled 1 command.
- Go to the Microprofile and find the region with the specified name.

The Begin() and End() functions make the profiling scope available for both the Profiler and the Microprofile.
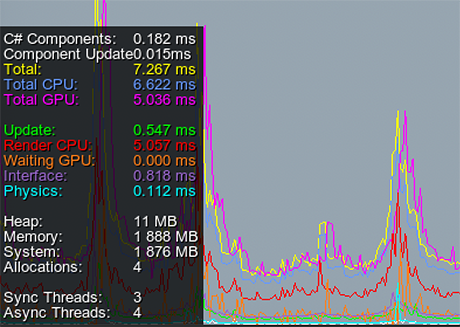
If you want to use the Microprofile only, create the counter via the Profiler.BeginMicro() and Profiler.EndMicro() functions.
private void Update()
{

	// start profiling
	int id = Profiler.BeginMicro("Component Update");

	float time = Game.Time;

	Vec3 pos = new Vec3(MathLib.Sin(time) * RADIUS, MathLib.Cos(time) * RADIUS, 0.0f);

	trigger.Enabled = pos.x > 0.0f || pos.y > 0.0f;
	trigger.WorldPosition = pos;

	// stop profiling
	Profiler.EndMicro(id);

}
Creating Nested Counters for Profiling#
To create several nested counters, you should use the Profiler.BeginMicro() and Profiler.EndMicro() functions. BeginMicro() returns an identifier that should be passed to EndMicro(). This enables to create nested and intersecting profiler counters.
In the following example, combination of Begin()/End() and BeginMicro()/EndMicro() is used. So, profiling of the Update() function will be available in both the Profiler and the Microprofile.
private void Update()
{

	// start profiling
	Profiler.Begin("Component Update");

	float time = Game.Time;

	// start a nested counter
	int id_0 = Profiler.BeginMicro("Trigger Position");

	Vec3 pos = new Vec3(MathLib.Sin(time) * RADIUS, MathLib.Cos(time) * RADIUS, 0.0f);

	// stop the counter
	Profiler.EndMicro(id_0);

	trigger.Enabled = pos.x > 0.0f || pos.y > 0.0f;
	trigger.WorldPosition = pos;

	// stop profiling
	Profiler.End();

}
Profiling Logic Using Macros#
There are special macros to mark fragments of your code that should be inspected. They can be used instead of the BeginMicro() and EndMicro() functions:
-
UNIGINE_PROFILER_FUNCTION to inspect performance of the function.
Using Macro Using Functions Source code (C#)void myFunction() { UNIGINE_PROFILER_FUNCTION; // your function code }Source code (C#)void myFunction() { int id = Profiler.BeginMicro(__FUNCTION__); // your function code Profiler.EndMicro(id); } -
UNIGINE_PROFILER_SCOPED to inspect only a certain part of the code.
Using Macro Using Functions Source code (C#)void myFunction() { // your function code { UNIGINE_PROFILER_SCOPED("Scope name"); // your function code } }Source code (C#)void myFunction() { // your function code { int id = Profiler.BeginMicro("Scope name"); // your function code Profiler.EndMicro(id); } }
Video Tutorial: Performance Inspection with Microprofile#
The information on this page is valid for UNIGINE 2.20 SDK.
