Отладка C# компонентов
 You can inspect the source code of your C# components while your application is running. Debugging of C# code is supported for the following IDEs: Вы можете проверять исходный код ваших компонентов C# во время работы вашего приложения. Отладка кода C# поддерживается для следующих IDE:
- Visual Studio Code (рекомендуется)
- Microsoft Visual Studio (2019)
.NET 5 SDK should be installed. In case of any issues with .NET 5, please refer to the related troubleshooting section.Должен быть установлен .NET 5 SDK. В случае каких-либо проблем с .NET 5, обратитесь к соответствующему разделу устранения неполадок . You can also make use of logging and console messages for debugging purposes. Вы также можете использовать логирование и сообщения консоли для отладки.
Logging and Printing Messages to ConsoleВедение журнала и печать сообщений в консоль#
Printing messages to the log file and console helps monitoring overall progress of execution of your application and report errors which can be used in debugging. Log class makes it possible to print formatted string messages to the log file and the console. Печать сообщений в файл журнала и в консоль помогает отслеживать общий ход выполнения вашего приложения и сообщать об ошибках, которые можно использовать при отладке. Класс Log позволяет выводить форматированные строковые сообщения в файл журнала и на консоль.
To enable displaying messages in the Console onscreen overlay use the following command: console_onscreen 1or do the same via code:
Console.Run("console_onscreen 1");или сделайте то же самое с помощью кода:
Console.Run("console_onscreen 1");The code below demonstrates how to print various types of messages: В приведенном ниже коде показано, как распечатать различные типы сообщений:
// auxiliary variables for messages
string file_name = "file.txt";
int ID = 10;

// reporting an error message
Log.Error("Loading mesh: can't open \"{0}\" file\n", file_name);

// reporting a message
Log.Message("-> Added {0} UI elements.\n", ID);

// reporting a warning message
Log.Warning("ID of the \"{0}\" file: {1}.\n", file_name, ID);

// reporting a fatal error message to the log file and closing the application
Log.Fatal("FATAL ERROR reading \"{0}\" file!\n", file_name);
See AlsoСмотрите также#
- For more information on the console, see Console page. Дополнительную информацию о консоли см. на странице Console .
- For more information on the Log class, see Log class page. Для получения дополнительной информации о классе журнала см. страницу Log class .
- The video tutorial demonstrating how to print user messages to console using C# Component System. Видеоурок , демонстрирующий, как выводить сообщения пользователя на консоль с помощью системы компонентов C#.
Debugging in Visual Studio CodeОтладка в Visual Studio Code#
Visual Studio Code is known for its excellent debugging tools. Built-in debugging support is available for the Node.js runtime, while others are implemented as extensions. Visual Studio Code известен своими отличными инструментами отладки. Встроенная поддержка отладки доступна для среды выполнения Node.js, а другие реализованы как расширения.
First of all, make sure that C# extension for Visual Studio Code is installed. If not, open the command palette in VS Code (press F1) and run Extensions: Install Extensions. Enter C# in the search box and press Enter. Select the extension and click Install
If you have previously installed the C# extension, make sure that you have a recent version. You can check this by opening the command palette (press F1) and running Extensions: Show Installed Extensions. Прежде всего, убедитесь, что установлен C# extension for Visual Studio Code. Если нет, откройте палитру команд в VS Code (нажмите F1) и запустите Extensions: Install Extensions. Введите C# в поле поиска и нажмите Enter. Выберите расширение и щелкните Install
Если вы ранее устанавливали расширение C#, убедитесь, что у вас установлена последняя версия. Вы можете проверить это, открыв палитру команд (нажмите F1) и запустив Extensions: Show Installed Extensions.
In VS Code, actually there are two debugging modes handling two different workflows: В VS Code на самом деле есть два режима отладки, обрабатывающих два разных рабочих процесса:
- Launch - debugging your application in the IDE, right after buiding and launching it. Launch - отладка вашего приложения в ICE сразу после его сборки и запуска.
- Attach - connecting to an already running instance of your application to debug it. Attach - подключение к уже запущенному экземпляру вашего приложения для его отладки.
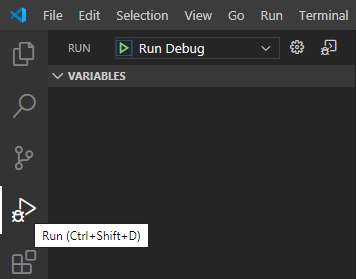
To start debugging you should bring up the Run view first. To do this select the Run icon in the Activity Bar on the side of VS Code or use the keyboard shortcut Ctrl+Shift+D. Чтобы начать отладку, вы должны сначала вызвать представление «Выполнить». Для этого выберите значок Run в поле Activity Bar на стороне VS Code или используйте сочетание клавиш Ctrl+Shift+D.
Debugging in IDEОтладка в IDE#
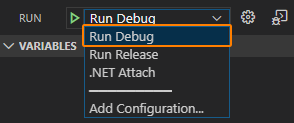
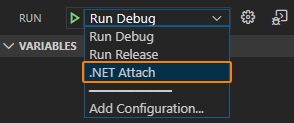
To compile all your components, build your application, and debug it running right from the IDE (without switching to UnigineEditor and clicking the Play button) you should select Run Debug in the Run dropdown: Чтобы скомпилировать все ваши компоненты, собрать приложение и отладить его, запустив его прямо из IDE (без переключения на UnigineEditor и нажатия кнопки Play), вы должны выбрать Run Debug в раскрывающемся списке Run:
Now you can add necessary breakpoints and simply hit F5 to launch the debugging process. Теперь вы можете добавить необходимые точки останова и просто нажать F5, чтобы запустить процесс отладки.
By default your application will run with the default world set for your project by the SDK Browser upon creation. По умолчанию ваше приложение будет работать с миром по умолчанию, установленным для вашего проекта браузером SDK при создании.
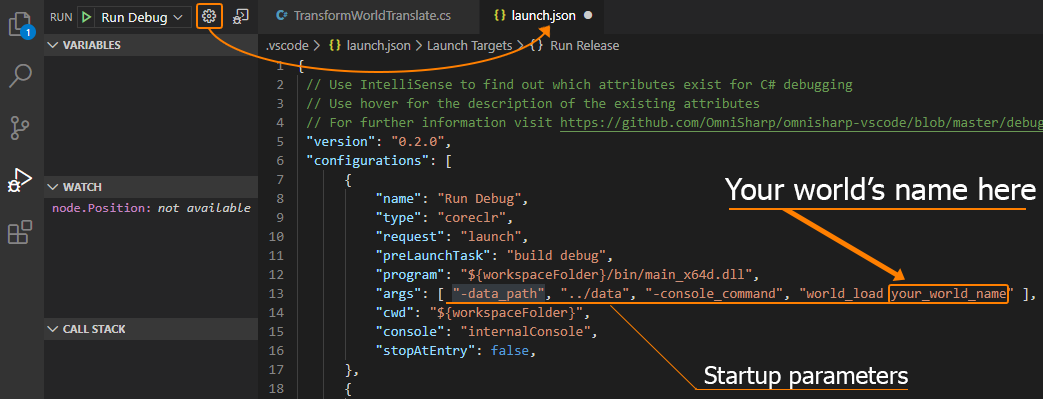
If the default world is not set, after launching your application you'll see a black screen. In this case you can open the console (press "~" on the keyboard) and load the desired world via the world_load console command or via API. Если мир по умолчанию не установлен, после запуска приложения вы увидите черный экран. В этом случае вы можете открыть консоль (нажмите "~" на клавиатуре) и загрузить желаемый мир с помощью консольной команды world_load или через API. To change or specify the default world, as well as the path to the data folder, or any other startup parameters click the Gear button. This will open the launch.json file containing debugger configuration. Startup parameters of the target application (your project) can be specified in the "args" element. Чтобы изменить или указать мир по умолчанию, а также путь к папке data или любые другие параметры запуска , нажмите кнопку Шестеренка . Это откроет файл launch.json, содержащий конфигурацию отладчика. Параметры запуска целевого приложения (вашего проекта) можно указать в элементе "args".
Debugging via Attaching to Running ApplicationОтладка путем подключения к запущенному приложению#
You can also connect VS Code debugger to an instance of your application that is already running - the most common case is launching it via the Play button in the UnigineEditor. In this case you should select .NET Attach in the Run dropdown: Вы также можете подключить отладчик VS Code к экземпляру вашего приложения, которое уже запущено - наиболее распространенный случай - запускать его с помощью кнопки Play в UnigineEditor. В этом случае вы должны выбрать .NET Attach в раскрывающемся списке Run:
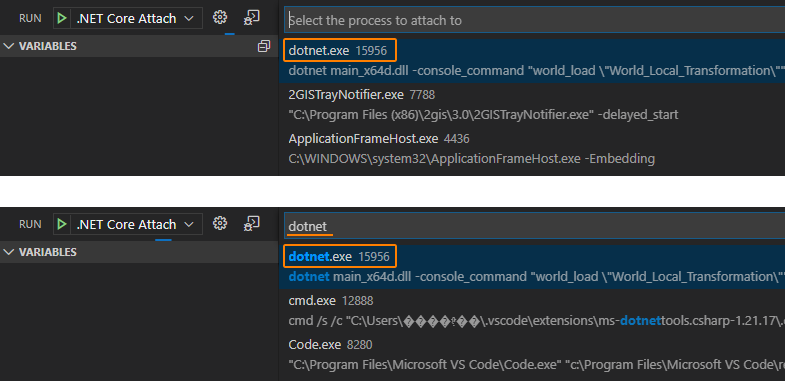
Now you can add necessary breakpoints and simply hit F5 to launch the debugging process. The only difference here is that you should select the application to attach to. You should select the first process in the list named dotnet.exe (type "dotnet" in the search field to find it quickly). Теперь вы можете добавить необходимые точки останова и просто нажать F5, чтобы запустить процесс отладки. Единственное отличие здесь в том, что вы должны выбрать приложение, к которому нужно прикрепиться. Вы должны выбрать первый процесс в списке с именем dotnet.exe (введите «dotnet» в поле поиска, чтобы быстро его найти).
Setting BreakpointsУстановка точек останова#
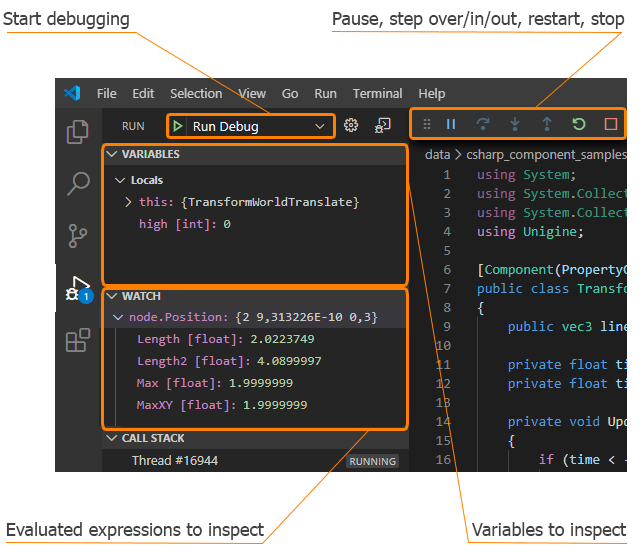
Breakpoints are used to pause your application by stopping execution of your code and giving you a chance to inspect and analyze your program's operation. You can check values of variables, and move step-by-step through your code. Точки останова используются для приостановки вашего приложения, останавливая выполнение вашего кода и давая вам возможность проверить и проанализировать работу вашей программы. Вы можете проверять значения переменных и поэтапно перемещаться по коду.
To set up a breakpoint put the cursor to the desired line of your code and press F9 or use the menu. Чтобы установить точку останова, поместите курсор на нужную строку вашего кода и нажмите F9 или используйте меню.
For more detailed information on debugging in Visual Studio Code please follow this link. Для получения более подробной информации об отладке в Visual Studio Code перейдите по этой ссылке .
Debugging in Microsoft Visual StudioОтладка в Microsoft Visual Studio#
Debugging in IDEОтладка в IDE#
To compile all your components, build your application, and debug it running right from the IDE (without switching to UnigineEditor and clicking the Play button) you should add necessary breakpoints and simply hit F5 to launch the debugging process. Чтобы скомпилировать все ваши компоненты, собрать приложение и отладить его, запустив его прямо из IDE (без переключения на UnigineEditor и нажатия кнопки Play), вам следует добавить необходимые точки останова и просто нажать F5 , чтобы запустить процесс отладки.
By default your application will run with the default world set for your project by the SDK Browser upon creation. По умолчанию ваше приложение будет работать с миром по умолчанию, установленным для вашего проекта браузером SDK при создании.
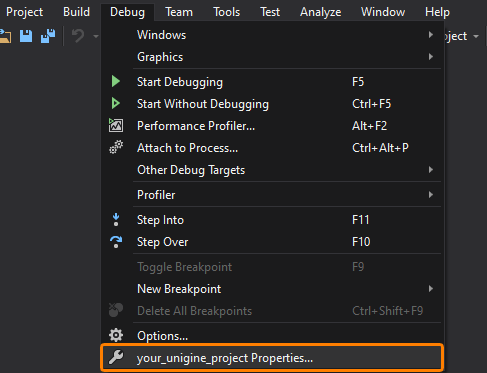
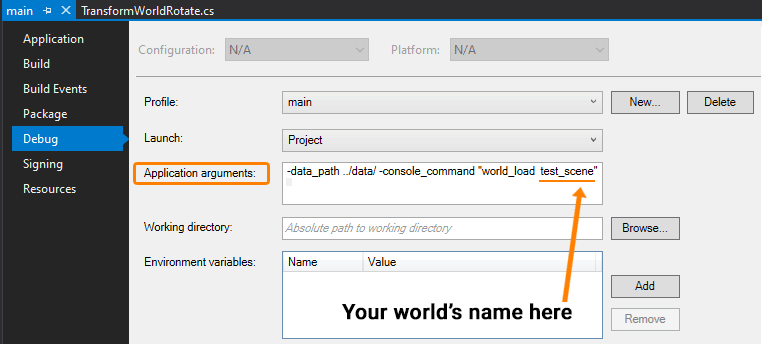
If the default world is not set, after launching your application you'll see a black screen. In this case you can open the console (press "~" on the keyboard) and load the desired world via the world_load console command or via API. Если мир по умолчанию не установлен, после запуска приложения вы увидите черный экран. В этом случае вы можете открыть консоль (нажмите "~" на клавиатуре) и загрузить желаемый мир с помощью консольной команды world_load или через API. To change or specify the default world, as well as the path to the data folder, or any other startup parameters choose Debug -> your_project_name Properties in the main menu. Чтобы изменить или указать мир по умолчанию, а также путь к папке data или любые другие параметры запуска , выберите Debug -> your_project_name Properties в главном меню.
This will open the following window with debugger configuration for your project. Startup parameters of the target application (your project) can be specified in the Application arguments field. Откроется следующее окно с конфигурацией отладчика для вашего проекта. Параметры запуска целевого приложения (вашего проекта) можно указать в поле Application arguments.
Debugging via Attaching to Running ApplicationОтладка путем подключения к запущенному приложению#
You can also connect Visual Studio debugger to an instance of your application that is already running - the most common case is launching it via the Play button in the UnigineEditor. Вы также можете подключить отладчик Visual Studio к экземпляру вашего приложения, которое уже запущено - наиболее распространенный случай - запускать его с помощью кнопки Play в UnigineEditor.
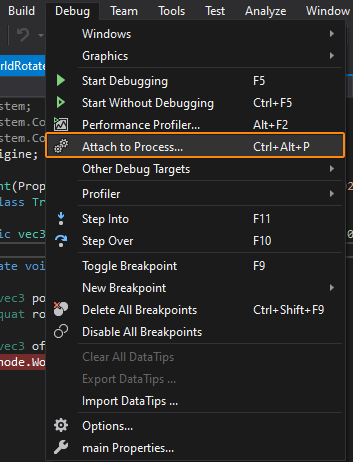
First, you should add necessary breakpoints. Then you can choose Debug -> Attach to Process in the main menu (or hit Ctrl + Alt + P) to launch the debugging process. Во-первых, вы должны добавить необходимые точки останова . Затем вы можете выбрать Debug -> Attach to Process в главном меню (или нажать Ctrl + Alt + P), чтобы запустить процесс отладки.
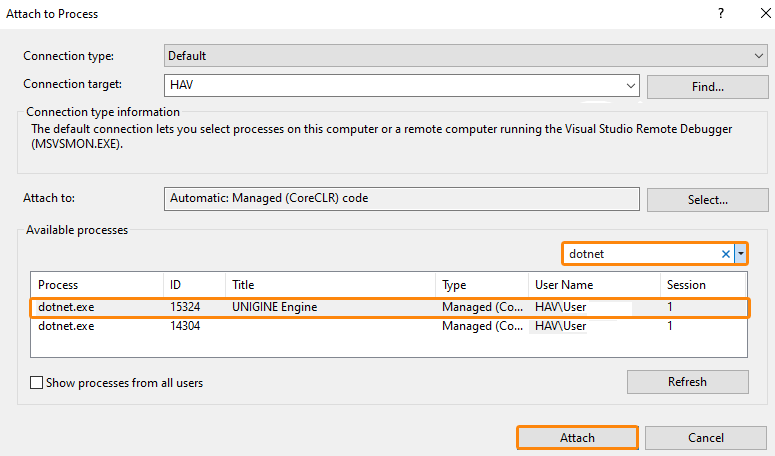
The next thing you should do is select the application to attach to. You should select the first process named dotnet.exe in the Available processes list (type dotnet" in the filter field to find it quickly). Then click Attach. Следующее, что вам нужно сделать, это выбрать приложение, к которому нужно прикрепиться. Вы должны выбрать первый процесс с именем dotnet.exe в списке Available processes (введите dotnet" в поле фильтра, чтобы быстро его найти). Затем нажмите Attach.
Setting BreakpointsУстановка точек останова#
Breakpoints are used to pause your application by stopping execution of your code and giving you a chance to inspect and analyze your program's operation. You can check values of variables, and move step-by-step through your code. Точки останова используются для приостановки вашего приложения, останавливая выполнение вашего кода и давая вам возможность проверить и проанализировать работу вашей программы. Вы можете проверять значения переменных и поэтапно перемещаться по коду.
To set up a breakpoint put the cursor to the desired line of your code and press F9 or use the menu. Чтобы установить точку останова, поместите курсор на нужную строку вашего кода и нажмите F9 или используйте меню.
For more detailed information on debugging in Microsoft Visual Studio please follow this link. Для получения более подробной информации об отладке в Microsoft Visual Studio перейдите по этой ссылке .
Debugging on LinuxОтладка в Linux#
There is an issue taking place when debugging your application on Linux. After reaching a breakpoint the mouse cursor is grabbed by the Engine making it impossible to switch back to code editor. This section describes a workaround helping you overcome this issue. Возникла проблема при отладке вашего приложения в Linux. После достижения точки останова движок захватывает курсор мыши, что делает невозможным переключение обратно в редактор кода. В этом разделе описан обходной путь, который поможет вам решить эту проблему.
The workflow is as follows: Рабочий процесс выглядит следующим образом:
- Insert the following code to AppSystemLogic.cs or to any component's code:
Исходный код (C#)Вставьте следующий код в AppSystemLogic.cs или в любой код компонента:
public class Debugger { public static void ReleaseMouse() { App.MouseGrab = false; App.MouseCursorHide = false; App.MouseCursorNeedUpdate = true; App.UpdateMouseCursor(); } }Исходный код (C#)public class Debugger { public static void ReleaseMouse() { App.MouseGrab = false; App.MouseCursorHide = false; App.MouseCursorNeedUpdate = true; App.UpdateMouseCursor(); } } - Then we can put a breakpoint anywhere in the code, launch the debug process as described above, and test our application Затем мы можем поставить точку останова в любом месте кода, запустить процесс отладки, как описано выше, и протестировать наше приложение.
- After reaching the breakpoint, switch focus to the Debug Console window by hitting Ctrl + Shift + Y on the keyboard По достижении точки останова переключите фокус на окно Debug Console, нажав Ctrl + Shift + Y на клавиатуре.
- Type the following line in the console:
Исходный код (C#)and press Enter
Debugger.ReleaseMouse();
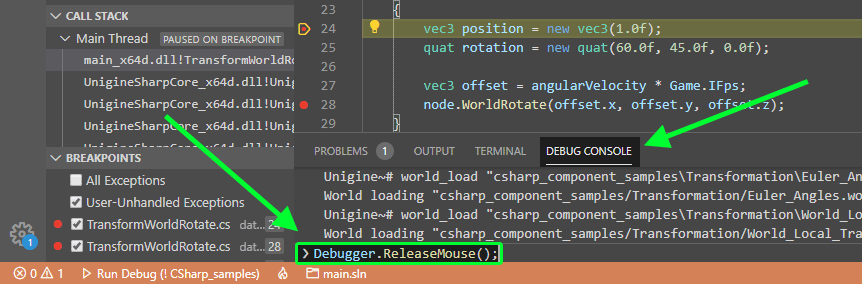 Введите в консоли следующую строку:
Исходный код (C#)и нажмите Enter
Введите в консоли следующую строку:
Исходный код (C#)и нажмите EnterDebugger.ReleaseMouse();
- Mouse cursor is unlocked! Курсор мыши разблокирован!
You have to type this only once, then you can perform these actions via hotkeys:
[Ctrl + Shift + Y] -> Arrow_Up -> [Enter] (Visual Studio Code). Вам нужно ввести это только один раз, затем вы можете выполнить эти действия с помощью горячих клавиш:
[Ctrl + Shift + Y] -> Arrow_Up -> [Enter] (Visual Studio Code).
The same approach works for other IDEs as well. Each of them has its own "Debug Console", enabling you to execute code when the application is paused. So, you should locate it, open, and execute this code: Debugger.ReleaseMouse();. Такой же подход работает и для других IDE. Каждый из них имеет свою собственную «Консоль отладки», позволяющую выполнять код, когда приложение приостановлено. Итак, вы должны найти его, открыть и выполнить этот код: Debugger.ReleaseMouse();.