Textures Optimization
Textures are often the most frequently used and the most memory-consuming assets. Big projects with a huge number of assets have to face the optimization stage to improve performance and have acceptable FPS.
An overview of the project's bottlenecks is given by Performance Profiler. By using the Rendering Performance Profiler, you can estimate the amount of video memory consumed by textures.

Adjust the global Textures Settings to quickly choose the desired Quality or Maximum Resolution of all textures in the project and thus decrease the video memory consumption. Mipmaps of lower resolution are used for rendering textures of lower quality.

Asynchronous Streaming#
Asynchronous Data Streaming of graphic resources ensures smooth loading of textures without spikes and other impacts on performance at first moments of run time. Make sure it is enabled for your worlds with a massive number of textures that certainly do not fit into video memory.
To make sure the video memory budget is not exceeded, there is a memory limit that controls freeing unnecessary resources. This limit is available in the Rendering Profiler as the second value of the VRAM Textures (after the slash). Please note that this setting is just a recommendation for the engine, and the specified memory limit can be exceeded if textures are required to render the current frame.
Setting a low memory limit for textures is not reasonable as in this case, textures will be constantly reloaded from the disk storage, affecting the performance.
Texture Cache used for rendering when full-size textures are being loaded also occupies video memory. Although it usually takes very little space, consider lowering the resolution and, therefore, the size of cached textures to gain more free memory.
Texture Formats#
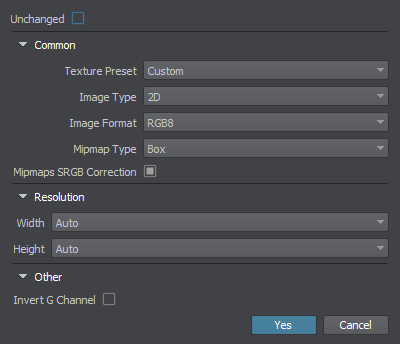
You can control each texture asset in its Import Parameters.

It is usually inappropriate to use textures with the Unchanged option enabled unless they have the *.dds or *.texture format. Otherwise, compression may affect the color data a lot (like with custom hdri textures).
It is crucial to use the correct Texture Preset for every texture, depending on its applicability. Thus, you ensure to use only needed channels and apply a proper compression algorithm. If the list does not provide a required preset, you can select the Custom option and choose the needed options.
You can also manually select the desired resolution of the texture in the Import Options.
Texture Profiler#
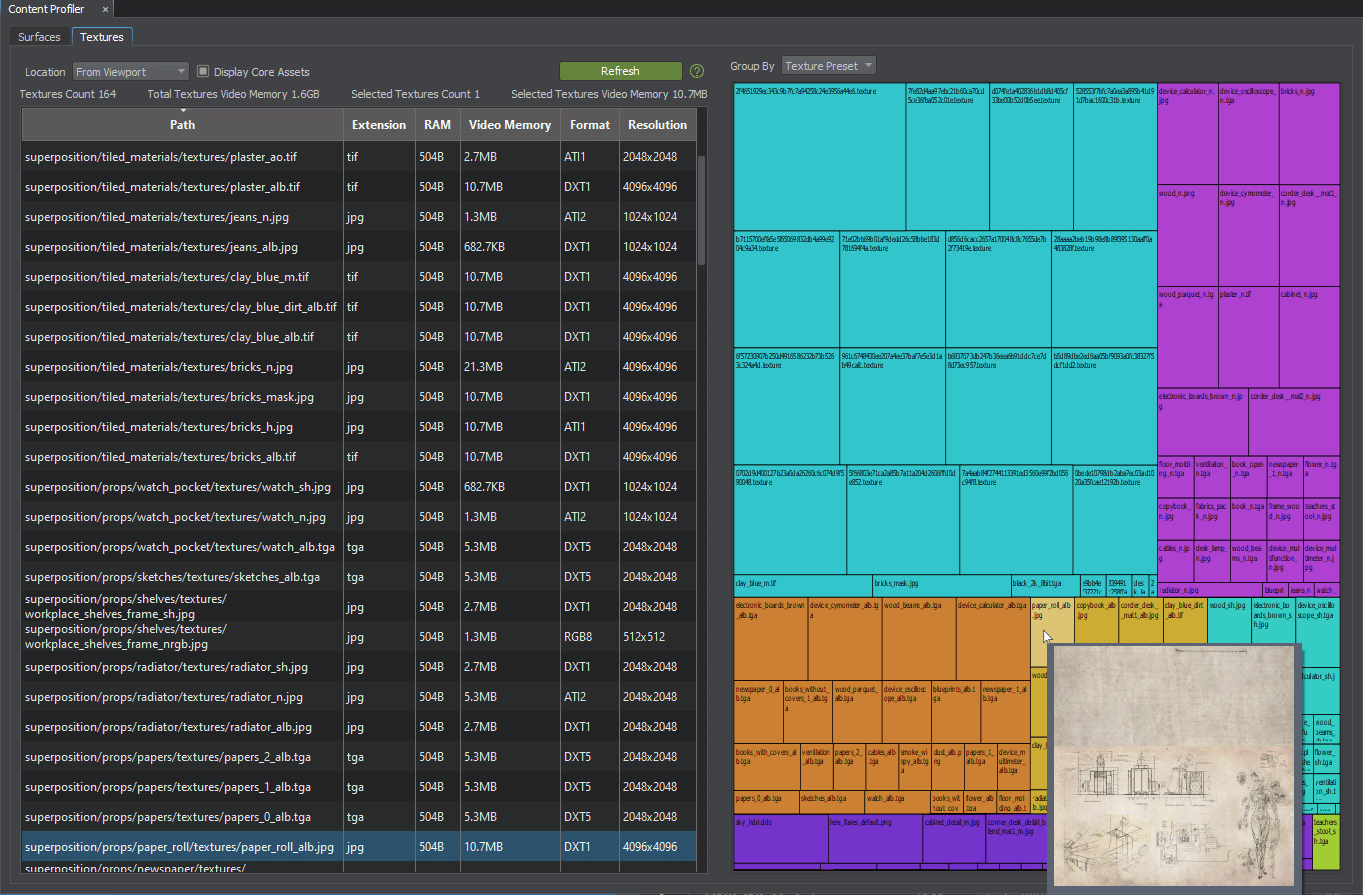
To clearly understand which assets can be optimized or deleted, Texture Profiler is used. Using this tool, you can see how much memory every texture used in the project takes, easily find it in Asset Browser, and delete or resize it.
To open the Texture Profiler window, choose Tools -> Content Profiler on the Menu Bar of UnigineEditor and switch to the Textures tab. By using the Location switch, you can choose to inspect the textures either from the entire video memory or only the ones displayed in the Editor viewport at the moment.

Texture Profiler allows sorting by path, extension, occupied RAM or Video Memory size, format, or resolution.