性能分析器
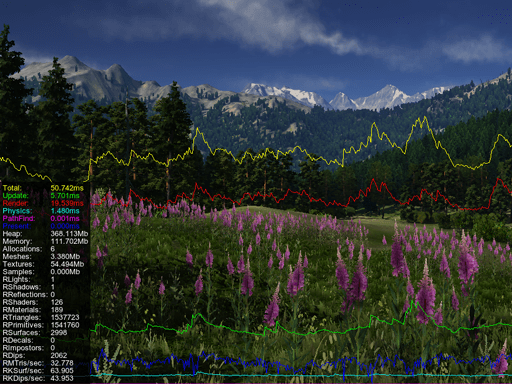
 A performance profiler displays performance data in a timeline. It reports how much time is spent per each frame for updating all aspects of your project: rendering nodes that are in view, updating their states, executing scripts with game logic, calculating physics, etc.性能分析器在时间轴上显示性能数据。它报告每帧花费多少时间来更新项目的各个方面:渲染可见的节点,更新其状态,使用游戏逻辑执行脚本,计算物理量等等。
With the profiler, you can:使用事件分析器,您可以:
- Detect the bottlenecks of your application检测应用程序的瓶颈
- Check if art assets optimization is required检查是否需要优化艺术品资源
- Check if code optimization is required检查是否需要代码优化
- Compare the profiling results before and after the changes比较更改前后的概要分析结果
Performance Profiler性能分析器Activate Profilers激活分析器#
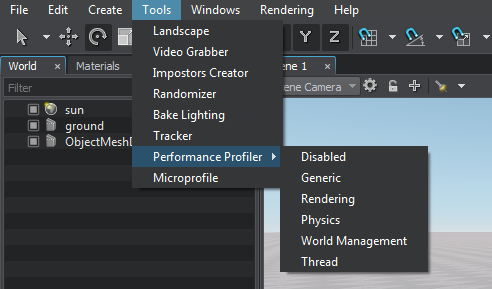
To turn the profiler on, click Tools -> Performance Profiler and choose the required profiling mode:要打开分析器,请单击Tools -> Performance Profiler并选择所需的分析模式:
You can also set a hot key (or a key combination) that will run the profiler in the Hotkeys section of the Settings window.
However, you will have to create a custom preset.
Then you can press this hot key for several times to cycle through profiling modes.
您还可以设置一个热键(或组合键),该热键将在窗口的HotkeysSettings部分中运行分析器。
但是,您将必须创建一个自定义预设。
然后,您可以按几次此热键以循环选择分析模式。
The following profiling modes are available:可以使用以下分析模式:
- Generic profiler shows only the general statistics block. Generic profiler仅显示常规统计信息块。
- Rendering profiler shows the detailed rendering statistics and the timeline chart. Rendering profiler显示详细的渲染统计信息和时间线图。
- Physics profiler shows the detailed physics-related statistics (within the Physics radius) and the timeline chart. Physics profiler显示了与物理相关的详细统计信息(在 Physics radius 之内)和时间线图。
- World Management profiler shows the statistics on the whole loaded world. World Management profiler显示了整个已加载世界的统计信息。
- Thread profiler shows the statistics on loading threaded resources. Thread profiler显示有关加载线程资源的统计信息。
To show profiler statistics in the in-game mode, type the show_profiler 1 command in the console. To disable the profiler in the in-game mode, type show_profiler 0 in the console.要在游戏模式中显示分析器统计信息,请在控制台中键入 show_profiler 1 命令。要在游戏模式中禁用分析器,请在控制台中键入 show_profiler 0。
Generic Profiler通用分析器#
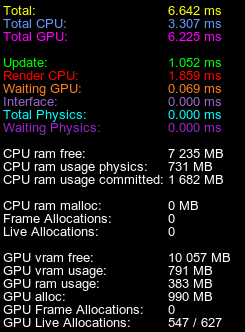
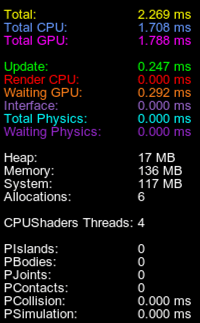
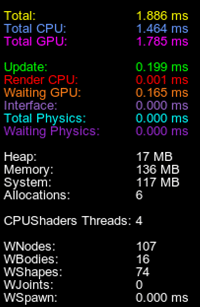
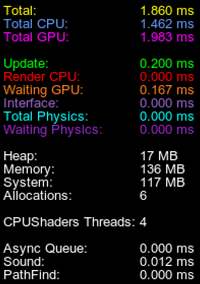
Generic Profiler Enabled启用通用配置文件| Total | Total time in milliseconds taken to both calculate and render the current frame. This is the duration of the main loop in the application execution sequence.
Total = Total CPU + Waiting GPU 计算和渲染当前帧所花费的总时间(以毫秒为单位)。这是应用程序执行顺序中的主循环的持续时间。 Total = Total CPU + Waiting GPU |
|---|---|
| Total CPU | Total time in milliseconds taken to prepare the current frame (including update, render, and swap).
准备当前帧(包括 update,render 和 swap )花费的总时间(以毫秒为单位)。
|
| Total GPU | Total time in milliseconds taken to render the current frame on the GPU. 注意
This counter may not work on some GPUs.在GPU上渲染当前帧所花费的总时间(以毫秒为单位)。This counter may not work on some GPUs.This counter may not work on some GPUs.注意
This counter may not work on some GPUs.此计数器可能在某些GPU上不起作用。 |
| Update | Time taken to update application logic. This includes executing all steps in the update() function of the world script. It also includes the update of states of all nodes (for example, update of the skinned animation or of a particle system to spawn new particles).
|
| Render CPU | Time taken to prepare all data to be rendered in the current frame and feed rendering commands from the CPU to the GPU. If Render CPU time is too high, it signals that art assets may need to be optimized, for example:
|
| Waiting GPU | Time between completing all calculations on the CPU up to the moment when the GPU has finished rendering the frame. (See the illustration). This counter is useful to analyze the bottleneck in your application's performance.
|
| Interface | Time taken to render all GUI widgets.呈现所有GUI小部件所需的时间。 |
| Total Physics | Time taken to perform all physics calculations.执行所有物理计算所需的时间。 |
| Waiting Physics | Time period during which the physics module waits for the completion of rendering process to return to the Main thread and execute the rest of the physics ticks.物理模块等待渲染过程完成以返回主线程并执行其余物理周期的时间段。 |
| CPU ram free | The amount of currently available memory.当前可用内存量。 |
| CPU ram usage physics | The current size of the working set. The working set is the set of memory pages currently visible in physical RAM (check the source).工作集的当前大小。工作集是当前在物理RAM中可见的内存页集(检查源)。 |
| CPU ram usage committed | The total amount of private memory that the memory manager has committed for a running process (check the source).内存管理器为正在运行的进程提交的私有内存总量(检查源)。 |
| CPU ram malloc | The amount of memory allocated by the UNIGINE custom allocator.UNIGINE自定义分配器分配的内存量。 |
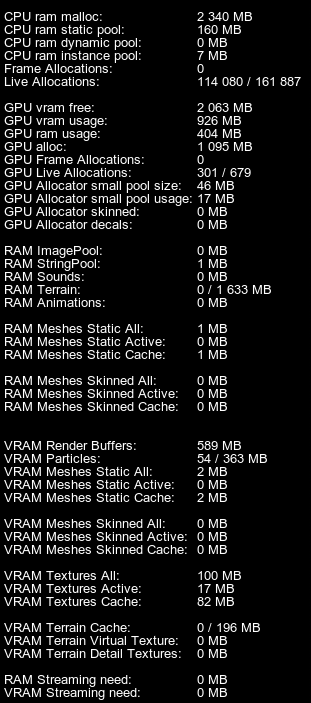
| CPU ram static pool | The amount of memory allocated in static pools.静态池中分配的内存量。 |
| CPU ram dynamic pool | The amount of memory allocated in dynamic pools. Available on Windows only.动态池中分配的内存量。仅适用于Windows。 |
| CPU ram instance pool | The amount of memory allocated in instance pools.实例池中分配的内存量。 |
| Frame Allocations | The number of allocations made per frame. The UNIGINE allocator allocates memory in pools which allows the allocation to be faster and more efficient.每帧进行的分配数量。UNIGINE分配器在池中分配内存,这使得分配更快,更高效。 |
| Live Allocations | The current number of allocations made / The maximum number of allocations made during runtime (peak consumption).当前所做的分配数/运行时所做的最大分配数(峰值消耗)。 |
| GPU vram free | The amount of currently available video memory.当前可用显存的数量。 |
| GPU vram usage | The amount of VRAM used by GPU. This value is provided by a graphics driver.GPU使用的VRAM量。此值由图形驱动程序提供。 |
| GPU ram usage | The amount of RAM used by GPU. This value is provided by a graphics driver.GPU使用的RAM量。此值由图形驱动程序提供。 |
| GPU alloc | The number of allocations made by the engine on GPU.引擎在GPU上进行的分配数量。 |
| GPU Frame Allocations | The number of video memory allocations made per frame.每帧进行的显存分配数。 |
| GPU Live Allocations | The current number of allocations made / The maximum number of allocations made during runtime (peak consumption).当前所做的分配数/运行时所做的最大分配数(峰值消耗)。 |
Memory Profiler内存分析器#
Memory Profiler Enabled内存分析器已启用The following statistics are displayed in addition to the generic one:除通用统计信息外,还显示以下统计信息:
The memory statistics provided in this section is available within the Rendering profiler when enabled via the UnigineEditor interface (Tools -> Performance Profiler -> Rendering).However, you can enable the Memory profiler separately by using the show_profiler_memory 1 console command. In this case, only memory statistics will be displayed.当通过UnigineEditor接口(Tools -> Performance Profiler -> Rendering)启用时,本节中提供的内存统计信息在渲染分析器中可用。
但是,您可以使用show_profiler_memory 1控制台命令单独启用内存分析器。在这种情况下,只会显示内存统计信息。
| GPU Allocator small pool size | The maximum size of the VRAM pool for small allocations.用于小分配的VRAM池的最大大小。 |
|---|---|
| GPU Allocator small pool usage | Actual usage of the video memory pool for small allocations.小分配的显存池的实际使用情况。 |
| GPU Allocator skinned | The amount of video memory allocated for skinned meshes.为蒙皮网格分配的显存量。 |
| GPU Allocator decals | The amount of video memory allocated for decals.为贴花分配的显存量。 |
| RAM ImagePool | Memory (RAM) amount currently used for the image pool.当前用于图像池的内存(RAM)量。 |
| RAM StringPool | Memory (RAM) amount currently used for the global string pool that stores duplicate strings. The string pool increases performance, as it stores only one string instead of its several duplicates. However, this pool is cleared only on the engine shutdown, so it is important to keep its size at the adequate level during runtime.当前用于存储重复字符串的全局字符串池的内存(RAM)量。字符串池提高了性能,因为它只存储一个字符串,而不是它的几个重复项。然而,这个池只在引擎关闭时被清除,所以在运行时保持足够的大小是很重要的。 |
| RAM Sounds | Memory (RAM) amount currently used for sound samples, in megabytes.当前用于声音样本的内存(RAM),单位为兆字节。 |
| RAM Terrain | Memory (RAM) amount currently used for terrain streaming, and the memory limit set for it, in megabytes. The memory limit is the maximum amount of RAM that can be used for terrain streaming.当前用于地形流的内存(RAM)量,以及为其设置的内存限制,以兆字节为单位。内存限制是可用于地形流的最大RAM量。 |
| RAM Animations | Memory (RAM) amount currently used for animations (stored in the .anim files).当前用于动画(存储在.anim文件中)的内存(RAM)量。 |
| RAM Meshes Static All | Total amount of RAM currently used for streaming static meshes.
注意
The same static mesh will use more RAM than VRAM, as additional data is generated in RAM to calculate collisions, intersections, spatial trees and so on.当前用于流式传输静态网格的RAM总量。
The same static mesh will use more RAM than VRAM, as additional data is generated in RAM to calculate collisions, intersections, spatial trees and so on.The same static mesh will use more RAM than VRAM, as additional data is generated in RAM to calculate collisions, intersections, spatial trees and so on. |
| RAM Meshes Static Active | Amount of RAM actively used for static meshes rendering.用于静态网格渲染的内存量。 |
| RAM Meshes Static Cache | Amount of RAM used for cached static meshes.用于缓存静态网格的RAM量。 |
| RAM Meshes Skinned All | Total amount of RAM currently used for streaming skinned meshes.当前用于流式蒙皮网格的RAM总量。 |
| RAM Meshes Skinned Active | Amount of RAM actively used for skinned meshes rendering.用于蒙皮网格渲染的RAM数量。 |
| RAM Meshes Skinned Cache | Amount of RAM used for cached skinned meshes.用于缓存蒙皮网格的RAM量。 |
| VRAM Render Buffers | Amount of VRAM currently used for rendering buffers (Gbuffer, post-effects, etc.), in megabytes.当前用于渲染缓冲区(Gbuffer,后期效果等)的VRAM数量,以兆字节为单位。 |
| VRAM Particles | Amount of VRAM currently used for vertices of particle systems, and the maximum amount of VRAM that can be used for them, in megabytes.当前用于粒子系统顶点的VRAM量,以及可用于它们的最大VRAM量,以兆字节为单位。 |
| VRAM Meshes Static All | Total amount of VRAM currently used for streaming static meshes.当前用于流式传输静态网格的VRAM总量。 |
| VRAM Meshes Static Active | Amount of VRAM actively used for static meshes rendering.用于静态网格渲染的VRAM数量。 |
| VRAM Meshes Static Cache | Amount of VRAM used for cached static meshes.用于缓存静态网格的VRAM量。 |
| VRAM Meshes Skinned All | Total amount of VRAM currently used for skinned meshes.当前用于蒙皮网格的VRAM总量。 |
| VRAM Meshes Skinned Active | Amount of VRAM actively used for skinned meshes rendering.用于蒙皮网格渲染的VRAM数量。 |
| VRAM Meshes Skinned Cache | Amount of VRAM used for cached skinned meshes.用于缓存蒙皮网格体的VRAM量。 |
| VRAM Textures All | Total amount of VRAM currently used for textures, and the maximum amount of VRAM that can be used for them, in megabytes.当前用于纹理的VRAM总量,以及可用于它们的最大VRAM量,以兆字节为单位。 |
| VRAM Textures Active | Amount of VRAM actively used for textures rendering.用于纹理渲染的VRAM量。 |
| VRAM Textures Cache | Amount of VRAM currently used for textures cache, in megabytes.当前用于纹理缓存的VRAM量,以兆字节为单位。 |
| VRAM Terrain Cache | Amount of VRAM cache currently used for Landscape Terrain tiles, in megabytes.当前用于Landscape Terrain图块的VRAM缓存量,以兆字节为单位。 |
| VRAM Terrain Virtual Texture | Amount of VRAM currently used for the Landscape Terrain virtual texture, in megabytes.当前用于Landscape Terrain虚拟纹理的VRAM量,以兆字节为单位。 |
| VRAM Terrain Detail Textures | Amount of VRAM currently used for Landscape Terrain details, in megabytes.当前用于Landscape Terrain详细信息的VRAM量,以兆字节为单位。 |
| RAM Streaming need | Amount of RAM that is currently need to be streamed.当前需要流式传输的RAM数量。 |
| VRAM Streaming need | Amount of VRAM that is currently need to be streamed.当前需要流式传输的VRAM数量。 |
Rendering Profiler渲染分析器#
Rendering Profiler Enabled渲染分析器已启用The following statistics are displayed in addition to the generic and memory statistics:除了通用和内存统计信息外,还显示以下统计信息:
When enabled via the UnigineEditor interface (Tools -> Performance Profiler -> Rendering), the profiler additionally provides the memory statistics.However, if you enable it using the show_profiler_render 1 console command, only statistics provided below will be displayed.当通过UnigineEditor接口(Tools -> Performance Profiler -> Rendering)启用时,分析器还提供内存统计信息。
但是,如果使用show_profiler_render 1控制台命令启用它,则只会显示下面提供的统计信息。
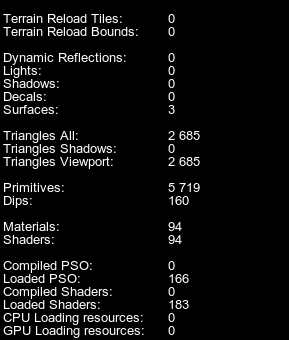
| Terrain Reload Tiles | Number of Landscape Terrain tiles that are currently awaiting reloading after being modified.修改后当前正在等待重新加载的Landscape Terrain 图块的数量。 |
|---|---|
| Terrain Reload Bounds | Number of events causing reloading of tiles (one bound may cause reloading of multiple tiles).导致重新加载图块的事件数(一个边界可能导致重新加载多个图块)。 |
| Dynamic Reflections | The number of dynamic reflections drawn per frame. In case of cubemap reflections, if all six faces are updated, six reflections are rendered each frame.每帧绘制的动态反射的数量。对于立方体贴图反射,如果所有六个面都更新,则每帧渲染六个反射。 |
| Lights | Number of light passes rendered per frame. This means that the counter displays the number of all light sources that are currently seen illuminating something in the viewport. This value also includes additional passes for rendering lights in the reflecting surfaces (if dynamical reflections are used). Plain 2D reflection will multiply the number of rendering passes by two, while cubemap-based reflection with six faces updated each frame will multiply the number of rendering passes by six.
注意
Each light redraws mesh polygons it illuminates. That is why the higher the number of light sources, the higher the number of polygons the graphics card has to render, and the lower the performance. For example, using two omni lights will as much as double the rendered geometry they shine on.每帧渲染的光通过数。这意味着计数器显示所有光源的数量,这些光源是当前可见的,并照亮视口中的某些东西。此值还包括用于在反射面中渲染光源的额外通道(如果使用动态反射)。一个普通的2D反射将渲染通道的数量乘以2,而基于立方体贴图的反射,每帧更新6个面,将渲染通道的数量乘以6。
Each light redraws mesh polygons it illuminates. That is why the higher the number of light sources, the higher the number of polygons the graphics card has to render, and the lower the performance. For example, using two omni lights will as much as double the rendered geometry they shine on.Each light redraws mesh polygons it illuminates. That is why the higher the number of light sources, the higher the number of polygons the graphics card has to render, and the lower the performance. For example, using two omni lights will as much as double the rendered geometry they shine on.注意
Each light redraws mesh polygons it illuminates. That is why the higher the number of light sources, the higher the number of polygons the graphics card has to render, and the lower the performance. For example, using two omni lights will as much as double the rendered geometry they shine on.每个光照都会重绘它所照亮的网格多边形。这就是为什么光源数量越多,显卡必须渲染的多边形数量就越多,性能就越低。例如,使用两个omni光源将使它们所照射的渲染几何体增加一倍。 |
| Shadows | Number of shadow passes rendered per frame. Each light requires a shadow pass to calculate the shadows. Again, if there are reflecting surfaces with shadows drawn reflected, this will increase the number of shadow passes.每帧渲染的阴影通道数。每个光源都需要一个阴影通道来计算阴影。同样,如果有反射曲面的阴影绘制反射,这将增加阴影通过的数量。 |
| Decals |
|
| Surfaces |
|
| Triangles All | Total number of triangles rendered per frame including all polygons that are currently visible in the viewport as well as the ones rendered in the process of shadows rendering.每帧渲染的三角形总数,包括当前在视口中可见的所有多边形以及在阴影渲染过程中渲染的多边形。 |
| Triangles Shadows | Number of triangles rendered per frame in the process of shadows rendering. Each light source has to redraw the geometry it illuminates, increasing the overall count of rendered triangles. In order to avoid GPU bottleneck, keep the number of dynamic light sources and their radius as low, as possible.在阴影渲染过程中,每帧渲染的三角形数量。每个光源导致再次绘制它照亮的几何图形,增加渲染三角形的总数。为了避免GPU瓶颈,保持动态光源的数量和半径尽可能低。 |
| Triangles Viewport | Number of triangles rendered per frame. This includes all polygons that are currently visible in the viewport (geometry).每帧渲染的三角形数。这包括当前在视口中可见的所有多边形(几何)。 |
| Primitives | Number of geometric primitives rendered per frame. This includes points, lines, triangles, and polygons. The visualizer and the profiler itself also add to this counter. The value differs dramatically if tessellation is used. In this case, Triangles reports the number of triangles in the coarse mesh, while Primitives shows statistics on the number of tessellated primitives.每帧渲染的几何图元数。这包括点、线、三角形和多边形。可视化工具和分析器本身也会添加到此计数器。如果使用镶嵌,这个值会有很大的不同。在这种情况下,Triangles报告粗网格中的三角形数量,而Primitives显示关于镶嵌图元数量的统计信息。 |
| Dips | The number of draw calls. The higher the number of identical mesh surfaces with the same material, the more effective the instancing is (enabled by default). This means, the number of draw calls is minimized offloading both the CPU and the GPU.
You can compare the number of surfaces (Surfaces) and the number of DIPs used to render them. For example, if there are 30000 surfaces and 1000 DIPs, it means that 30 instanced surfaces of meshes are rendered per only one draw call (Surfaces/Dips). Thus the instancing provides performance boost.绘制调用的数量。具有相同材质的相同网格曲面的数量越多,实例化就越有效(默认情况下启用)。这意味着,绘制调用的数量可以最大限度地减少cpu和GPU的负载。 您可以比较曲面的数量(Surfaces)和用于渲染它们的DIP的数量。例如,如果有30000个曲面和1000个DIP,这意味着每次绘制调用(Surfaces / Dips)渲染30个网格实例表面曲面。因此,实例化提供了性能提升。 |
| Materials | Number of materials set per frame. (Materials are set in each of the rendering passes.)每帧设置的材质数量。(材质设置在每个渲染通道中。) |
| Shaders | Number of shaders set per frame. (Shaders are set in each of the rendering passes; hence if only one material used, its shader still needs to be set several times. When nothing is visible and the screen is black, even in this case the composite shader is still used.) 每帧设置的着色器数量。(着色器在每个渲染通道中设置;因此,如果只使用一种材质,其着色器仍然需要设置几次。当没有任何东西是可见的并且屏幕是黑色的,即使在这种情况下,复合着色器仍然被使用。) |
| Compiled PSO | Number of PSOs that are currently compiled.当前编译的PSO数量。 |
| Loaded PSO | Current number of loaded PSOs.当前加载的PSO数量。 |
| Compiled Shaders | Number of shaders that are currently compiled.当前编译的着色器数。 |
| Loaded Shaders | Number of shaders loaded to RAM.加载到RAM的着色器数量。 |
Values less then 1 Mb are displayed as 0.小于1Mb的值显示为0。Physics Profiler物理分析器#
This profiler shows statistics within the Physics radius.此分析器显示物理半径内的统计信息。
You can enable this profiler via the UnigineEditor interface (Tools -> Performance Profiler -> Physics) and via the show_profiler_physics 1 console command.您可以通过UnigineEditor接口(Tools -> Performance Profiler -> Physics)和show_profiler_physics 1控制台命令启用此分析器。
Physics Profiler Enabled物理分析器已启用The following statistics are displayed in addition to the generic one:除了通用统计信息外,还显示以下统计信息:
| PIslands | Number of physical islands within the physics radius that could be calculated separately. The lower this number, the less efficient multi-threading is.物理半径内可以单独计算的物理岛的数量。这个数字越低,多线程的效率就越低。 |
|---|---|
| PBodies | Number of bodies within the physics radius.物理半径内实体的数量。 |
| PJoints | Number of joints within the physics radius.物理半径内关节的数量。 |
| PContacts | Total number of contacts within the physics radius; this includes contacts between the bodies (their shapes) and body-mesh contacts.物理半径内的总接触数;这包括体之间的接触(它们的形状)和体网格触点之间的触点。 |
| PCollision | Duration of the collision detection phase of physic simulation when collisions between objects are found.当发现物体之间的碰撞时,物理模拟的碰撞检测阶段的持续时间。 |
| PSimulation | Duration of all simulation phases added together.所有模拟阶段的持续时间加在一起. |
Watch an overview of the Physics Profiler options in our video tutorial on physics.在我们的物理视频教程中观看物理分析器选项的概述。
World Management Profiler世界管理分析器#
This profiler shows statistics on the whole world.这个分析器显示了整个世界的统计数据。
When in the editor mode, enabling and disabling of the node, body or a joint can increase values of world profiler counters, as a (limited) number of clones are created for undo/redo purposes.在编辑器模式下,启用和禁用节点、物体或关节可以增加世界分析器计数器的值,因为为撤消/重做目的创建了(有限)数量的克隆。
World Management Profiler Enabled世界管理分析器已启用You can enable this profiler via the UnigineEditor interface (Tools -> Performance Profiler -> World Management) and via the show_profiler_world 1 console command.您可以通过UnigineEditor接口(Tools -> Performance Profiler -> World Management)和show_profiler_world 1控制台命令启用此分析器。The following statistics is displayed in addition to the generic one:除了通用统计信息外,还显示以下统计信息:
| WNodes | Total number of nodes in the world (both enabled and disabled).世界节点总数(启用和禁用的)。 |
|---|---|
| WBodies | Total number of bodies in the world.世界里物体的总数。 |
| WShapes | Total number of shapes in the world.世界里形状的总数。 |
| WJoints | Total number of joints in the world.世界里关节的总数。 |
| WSpawn |
Time in milliseconds that the engine spends on generating content in procedural nodes (such as grass, clutters, world layers).
引擎在程序节点(如草,Clutter,世界层)中生成内容所花费的毫秒时间。
|
Thread Profiler线程分析器#
Thread Profiler Enabled线程分析器已启用You can enable this profiler via the UnigineEditor interface (Tools -> Performance Profiler -> Thread) and via the show_profiler_thread 1 console command.您可以通过UnigineEditor接口(Tools -> Performance Profiler -> Thread)和show_profiler_thread 1控制台命令启用此分析器。The following statistics are displayed in addition to the generic one:除了通用统计信息外,还显示以下统计信息:
| AsyncQueue | Time of asynchronous loading of resources (files/meshes/images/nodes), in milliseconds.异步加载资源(文件/网格/图像/节点)的时间,以毫秒为单位。 |
|---|---|
| Sound | Time of asynchronous loading of sounds, in milliseconds.异步加载声音的时间,以毫秒为单位。 |
| PathFind | Time of asynchronous pathfinding calculations, in milliseconds.异步寻路计算的时间,以毫秒为单位。 |
| CPUShaders Threads | Number of internal engine threads used for CPU shaders.用于CPU着色器的内部引擎线程数。 |
本页面上的信息适用于 UNIGINE 2.19 SDK.