调试C#组件
You can inspect the source code of your C# components while your application is running. Debugging of C# code is supported for the following IDEs:您可以在应用程序运行时检查C#组件的源代码。以下IDE支持C#代码的调试:
- Visual Studio Code (推荐的)
- Microsoft Visual Studio (2022)
You can also make use of logging and console messages for debugging purposes.您也可以使用日志记录和控制台消息进行调试。
Logging and Printing Messages to Console记录和打印消息到控制台#
Printing messages to the log file and console helps monitoring overall progress of execution of your application and report errors which can be used in debugging. Log class makes it possible to print formatted string messages to the log file and the console.将消息打印到日志文件和控制台有助于监视应用程序执行的总体进度并报告可用于调试的错误。 Log类使得可以将格式化的字符串消息打印到日志文件和控制台。
or do the same via code:
Console.Run("console_onscreen 1");或通过代码执行相同的操作:
Console.Run("console_onscreen 1");The code below demonstrates how to print various types of messages:下面的代码演示了如何打印各种类型的消息:
// auxiliary variables for messages
string file_name = "file.txt";
int ID = 10;

// reporting an error message
Log.Error("Loading mesh: can't open \"{0}\" file\n", file_name);

// reporting a message
Log.Message("-> Added {0} UI elements.\n", ID);

// reporting a warning message
Log.Warning("ID of the \"{0}\" file: {1}.\n", file_name, ID);

// reporting a fatal error message to the log file and closing the application
Log.Fatal("FATAL ERROR reading \"{0}\" file!\n", file_name);
See Also也可以看看#
Debugging in Visual Studio Code在Visual Studio Code中进行调试#
Visual Studio Code is known for its excellent debugging tools. Built-in debugging support is available for the Node.js runtime, while others are implemented as extensions. Visual Studio Code以其出色的调试工具而闻名。内置的调试支持可用于Node.js运行时,而其他调试功能则作为扩展实现。
First of all, make sure that C# extension for Visual Studio Code is installed. If not, open the command palette in VS Code (press F1) and run Extensions: Install Extensions. Enter C# in the search box and press Enter. Select the extension and click Install If you have previously installed the C# extension, make sure that you have a recent version. You can check this by opening the command palette (press F1) and running Extensions: Show Installed Extensions.首先,确保安装了C# extension for Visual Studio Code。如果不是,请在VS Code中打开命令面板(按F1),然后运行Extensions: Install Extensions。在搜索框中输入C#,然后按Enter。选择扩展名,然后单击Install 如果您先前已安装C#扩展名,请确保您具有最新版本。您可以通过打开命令面板(按F1)并运行Extensions: Show Installed Extensions来进行检查。
In VS Code, actually there are two debugging modes handling two different workflows:在VS Code中,实际上有两种调试模式可以处理两种不同的工作流程:
- Launch - debugging your application in the IDE, right after buiding and launching it. Launch-在构建和启动应用程序后立即在ICE中调试您的应用程序。
- Attach - connecting to an already running instance of your application to debug it. Attach-连接到已运行的应用程序实例以对其进行调试。
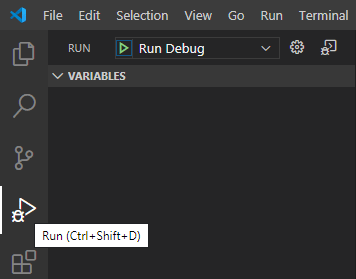
To start debugging you should bring up the Run view first. To do this select the Run icon in the Activity Bar on the side of VS Code or use the keyboard shortcut Ctrl+Shift+D.要开始调试,您应该首先打开“运行”视图。为此,请在VS Code的Activity Bar中选择Run图标,或使用键盘快捷键Ctrl+Shift+D。
Debugging in IDE在IDE中进行调试#
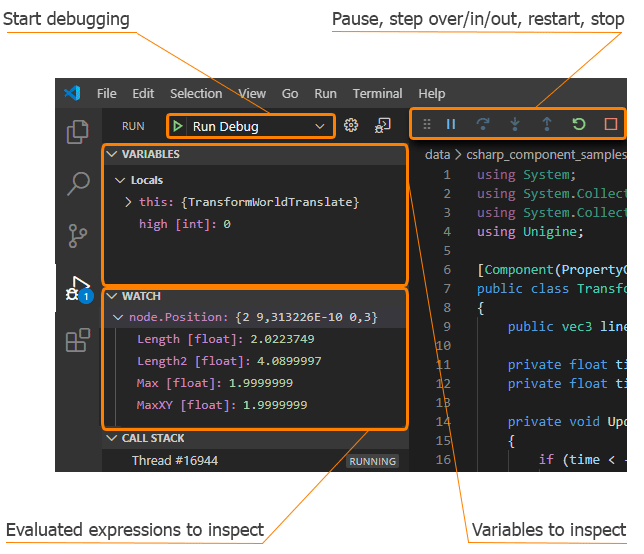
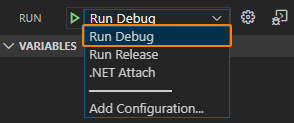
To compile all your components, build your application, and debug it running right from the IDE (without switching to UnigineEditor and clicking the Play button) you should select Run Debug in the Run dropdown:要编译所有组件,构建应用程序并在IDE上直接运行它(无需切换到UnigineEditor并单击Play按钮),应在Run Debug in the Run dropdown:
Now you can add necessary breakpoints and simply hit F5 to launch the debugging process.现在您可以添加必要的断点,只需单击F5以启动调试过程。
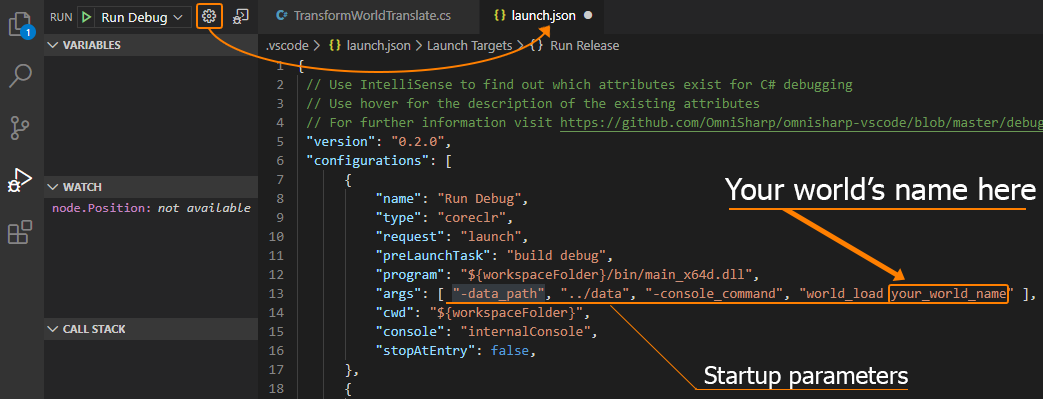
By default your application will run with the default world set for your project by the SDK Browser upon creation.默认情况下,应用程序将在创建时使用SDK浏览器为项目设置的默认世界运行。
To change or specify the default world, as well as the path to the data folder, or any other startup parameters click the Gear button. This will open the launch.json file containing debugger configuration. Startup parameters of the target application (your project) can be specified in the "args" element.要更改或指定默认世界以及data文件夹的路径,或其他任何启动参数,请单击 齿轮 按钮。这将打开包含调试器配置的launch.json文件。可以在"args"元素中指定目标应用程序(您的项目)的启动参数。
Debugging via Attaching to Running Application通过附加到正在运行的应用程序进行调试#
You can also connect VS Code debugger to an instance of your application that is already running - the most common case is launching it via the Play button in the UnigineEditor. In this case you should select .NET Attach in the Run dropdown:您还可以将VS Code调试器连接到已经运行的应用程序实例-最常见的情况是通过UnigineEditor中的Play按钮启动它。在这种情况下,您应该在.NET Attach in the Run dropdown:
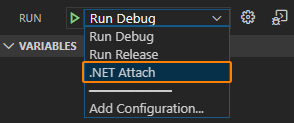
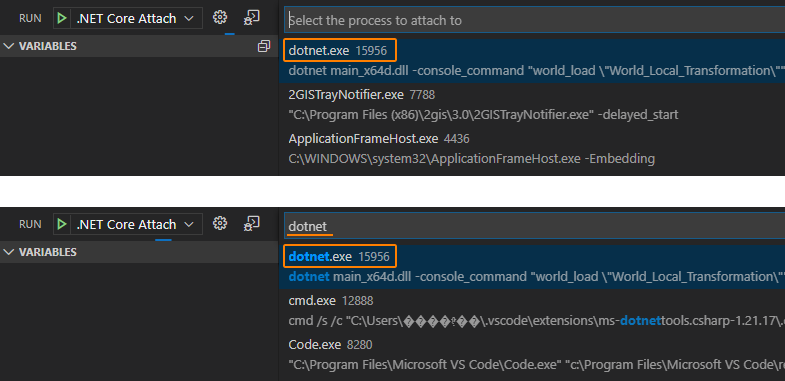
Now you can add necessary breakpoints and simply hit F5 to launch the debugging process. The only difference here is that you should select the application to attach to. You should select the first process in the list named dotnet.exe (type "dotnet" in the search field to find it quickly).现在您可以添加必要的断点,只需单击F5以启动调试过程。唯一的区别是您应该选择要附加的应用程序。您应该在名为dotnet.exe的列表中选择第一个进程(在搜索字段中键入“ dotnet”以快速找到它)。
Setting Breakpoints设定断点#
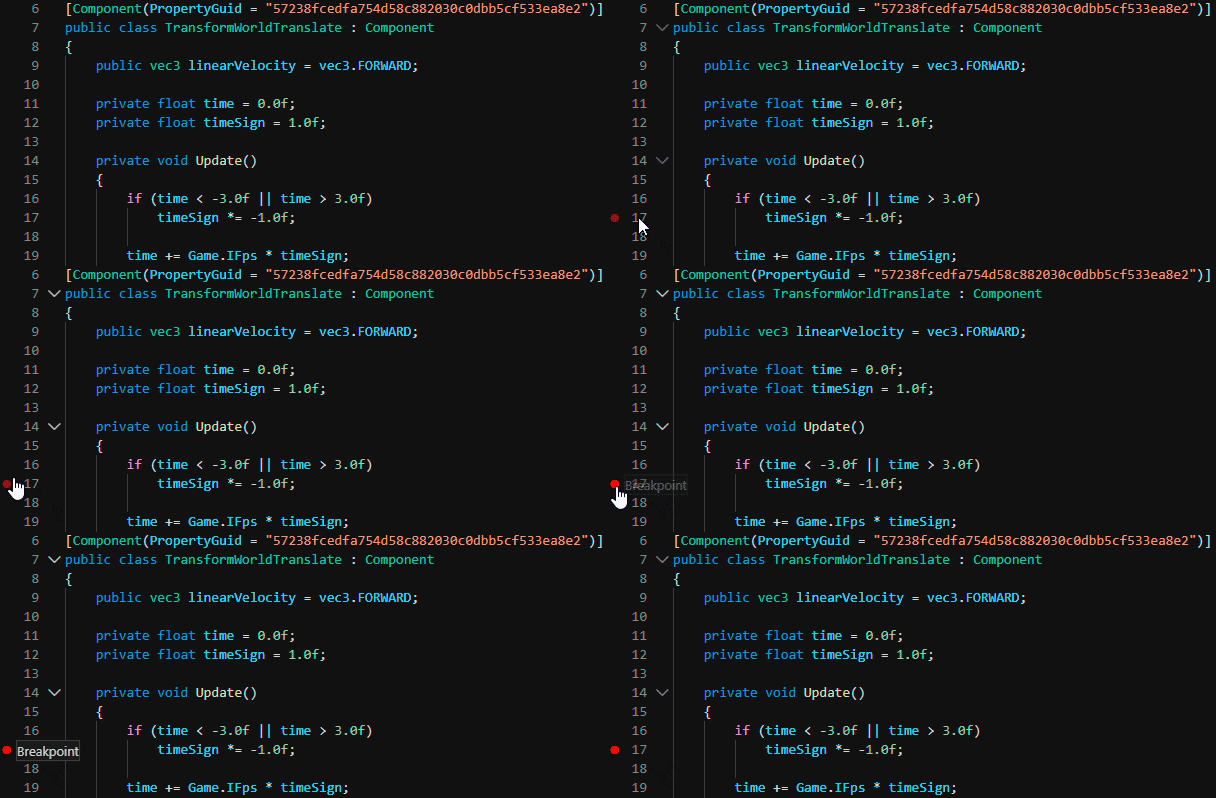
Breakpoints are used to pause your application by stopping execution of your code and giving you a chance to inspect and analyze your program's operation. You can check values of variables, and move step-by-step through your code.断点用于通过停止执行代码并为您提供检查和分析程序操作的机会来暂停应用程序。您可以检查变量的值,并逐步遍历代码。
To set up a breakpoint put the cursor to the desired line of your code and press F9 or use the menu.要设置断点,请将光标置于代码的所需行,然后按F9或使用菜单。
For more detailed information on debugging in Visual Studio Code please follow this link.有关在Visual Studio Code中调试的更多详细信息,请访问此链接。
Debugging in Microsoft Visual Studio在Microsoft Visual Studio中进行调试#
Debugging in IDE在IDE中进行调试#
To compile all your components, build your application, and debug it running right from the IDE (without switching to UnigineEditor and clicking the Play button) you should add necessary breakpoints and simply hit F5 to launch the debugging process.要编译所有组件,构建应用程序并在IDE上直接运行它(无需切换到UnigineEditor并单击Play按钮),则应添加必要的断点,只需按 F5 启动调试过程。
By default your application will run with the default world set for your project by the SDK Browser upon creation.默认情况下,应用程序将在创建时使用SDK浏览器为项目设置的默认世界运行。
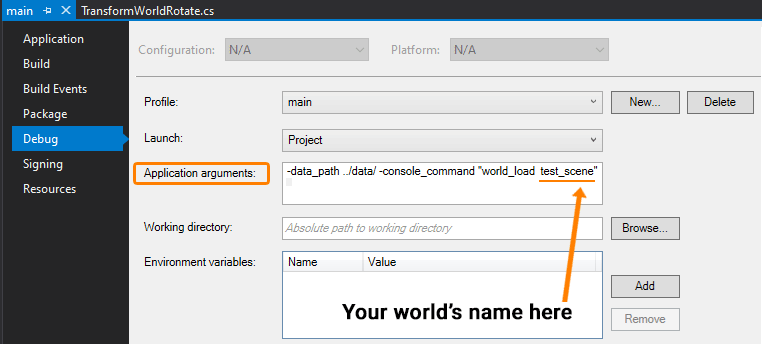
To change or specify the default world, as well as the path to the data folder, or any other startup parameters choose Debug -> your_project_name Properties in the main menu.要更改或指定默认世界以及data文件夹的路径,或其他任何启动参数,请在主菜单中选择Debug -> your_project_name Properties。
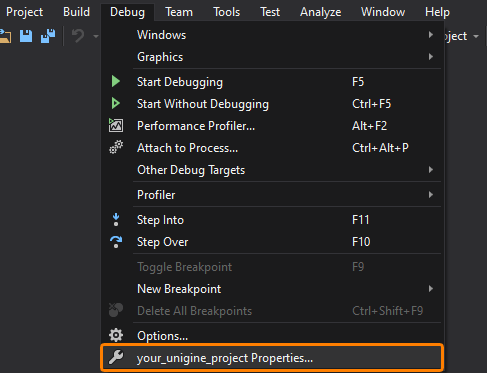
This will open the following window with debugger configuration for your project. Startup parameters of the target application (your project) can be specified in the Application arguments field.这将打开以下窗口,其中包含项目的调试器配置。可以在Application arguments字段中指定目标应用程序(您的项目)的启动参数。
Debugging via Attaching to Running Application通过附加到正在运行的应用程序进行调试#
You can also connect Visual Studio debugger to an instance of your application that is already running - the most common case is launching it via the Play button in the UnigineEditor.您还可以将Visual Studio调试器连接到已经运行的应用程序实例-最常见的情况是通过UnigineEditor中的Play按钮启动它。
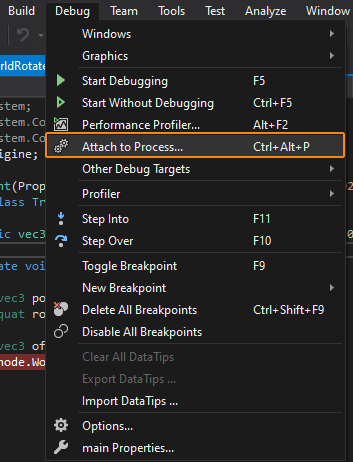
First, you should add necessary breakpoints. Then you can choose Debug -> Attach to Process in the main menu (or hit Ctrl + Alt + P) to launch the debugging process.首先,您应该添加必要的断点。然后,您可以在主菜单中选择Debug -> Attach to Process(或按Ctrl + Alt + P)以启动调试过程。
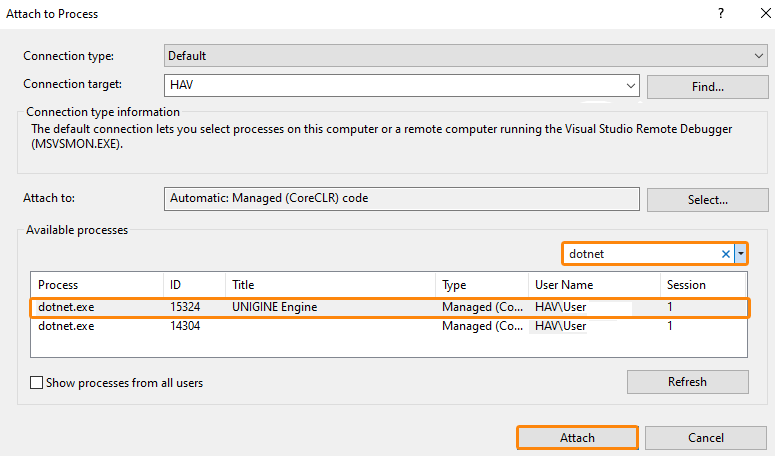
The next thing you should do is select the application to attach to. You should select the first process named dotnet.exe in the Available processes list (type dotnet" in the filter field to find it quickly). Then click Attach.接下来,您应该选择要附加的应用程序。您应该在Available processes列表中选择第一个名为dotnet.exe的进程 (输入 "dotnet"可以快速找到它)。然后单击Attach。
Setting Breakpoints设定断点#
Breakpoints are used to pause your application by stopping execution of your code and giving you a chance to inspect and analyze your program's operation. You can check values of variables, and move step-by-step through your code.断点用于通过停止执行代码并为您提供检查和分析程序操作的机会来暂停应用程序。您可以检查变量的值,并逐步遍历代码。
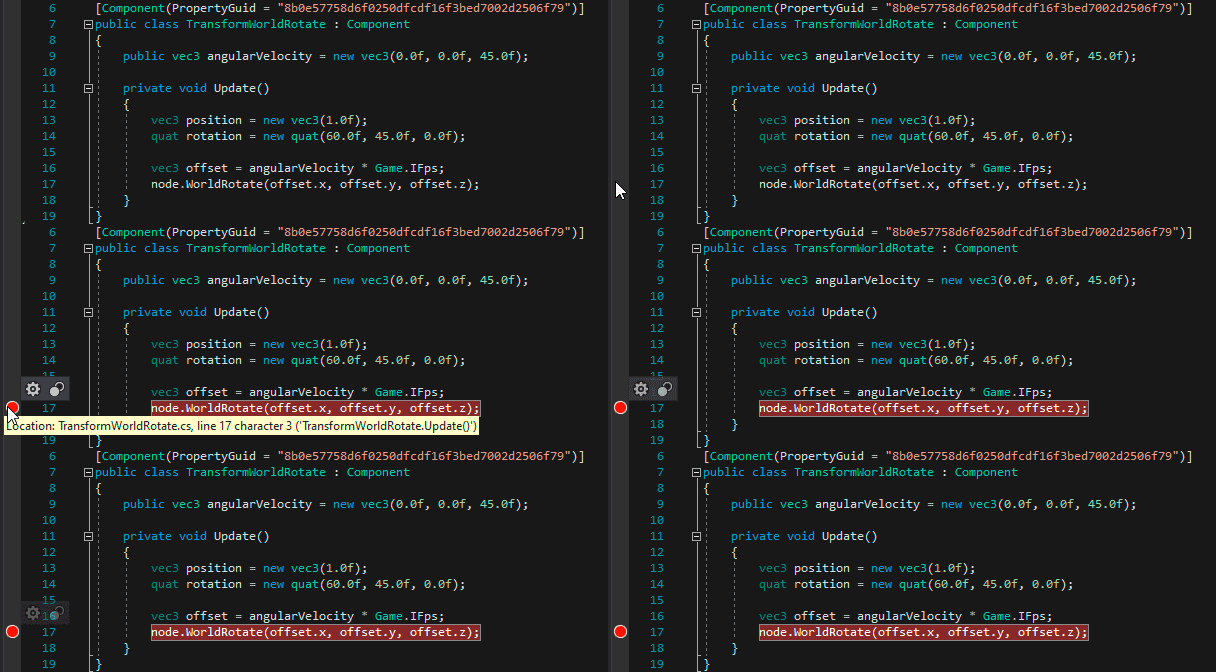
To set up a breakpoint put the cursor to the desired line of your code and press F9 or use the menu.要设置断点,请将光标置于代码的所需行,然后按F9或使用菜单。
For more detailed information on debugging in Microsoft Visual Studio please follow this link.有关在Microsoft Visual Studio中调试的更多详细信息,请访问此链接。
Debugging on Linux在Linux上进行调试#
There is an issue taking place when debugging your application on Linux. After reaching a breakpoint the mouse cursor is grabbed by the Engine making it impossible to switch back to code editor. This section describes a workaround helping you overcome this issue.在Linux上调试应用程序时发生问题。达到断点后,引擎将抓住鼠标光标,从而无法切换回代码编辑器。本节介绍了一种解决方法,可帮助您解决此问题。
The workflow is as follows:工作流程如下:
- Insert the following code to AppSystemLogic.cs or to any component's code:
源代码 (C#)将以下代码插入AppSystemLogic.cs或任何组件的代码:
public class Debugger { public static void ReleaseMouse() { App.MouseGrab = false; App.MouseCursorHide = false; App.MouseCursorNeedUpdate = true; App.UpdateMouseCursor(); } }源代码 (C#)public class Debugger { public static void ReleaseMouse() { App.MouseGrab = false; App.MouseCursorHide = false; App.MouseCursorNeedUpdate = true; App.UpdateMouseCursor(); } } - Then we can put a breakpoint anywhere in the code, launch the debug process as described above, and test our application然后我们可以在代码中的任意位置放置一个断点,如上所述启动调试过程,然后测试我们的应用程序
- After reaching the breakpoint, switch focus to the Debug Console window by hitting Ctrl + Shift + Y on the keyboard到达断点后,通过按键盘上的Ctrl + Shift + Y将焦点切换到Debug Console窗口
- Type the following line in the console:
源代码 (C#)and press Enter
Debugger.ReleaseMouse();
 在控制台中键入以下行:
源代码 (C#)然后按Enter
在控制台中键入以下行:
源代码 (C#)然后按EnterDebugger.ReleaseMouse();

- Mouse cursor is unlocked!鼠标光标已解锁!
You have to type this only once, then you can perform these actions via hotkeys:
[Ctrl + Shift + Y] -> Arrow_Up -> [Enter] (Visual Studio Code).您只需键入一次,即可通过热键执行以下操作:
[Ctrl + Shift + Y] -> Arrow_Up -> [Enter](Visual Studio Code)。
The same approach works for other IDEs as well. Each of them has its own "Debug Console", enabling you to execute code when the application is paused. So, you should locate it, open, and execute this code: Debugger.ReleaseMouse();.同样的方法也适用于其他IDE。它们每个都有自己的“调试控制台”,使您可以在应用程序暂停时执行代码。因此,您应该找到它,打开并执行以下代码:Debugger.ReleaseMouse();。
