Microprofile
UNIGINE has support for Microprofile, an advanced external embeddable CPU/GPU profiler with support for per-frame inspection. UNIGINE支持Microprofile,这是一种先进的外部可嵌入CPU / GPU分析器,支持逐帧检查。
The profiler features the following:探查器具有以下特点:
- Profiling operations performed by the engine on CPU and GPU.引擎在CPU和GPU上执行的分析操作。
- Profiling the engine threads.分析引擎线程。
- Profiling up to 1000 frames.最多分析1000帧。
- The performance data output to a local web server.性能数据输出到本地Web服务器或HTML文件。
Running Microprofile运行Microprofile#
The performance data obtained by the Microprofile can be output to a local web server.
Visualization Using Built-In Server使用内置服务器进行可视化#
To visualize the performance data using the local web server, perform the following:要使用本地Web服务器可视化性能数据,请执行以下操作:
- In the console, set the the number of frames to be profiled via the microprofile_webserver_frames console command. You can skip this step: by default, 500 frames will be profiled.在控制台中,通过 microprofile_webserver_frames 控制台命令设置要分析的帧数。您可以跳过此步骤:默认情况下,将分析 500 个帧。
- 如果需要,请禁用 GPU配置文件。
- On the Menu Bar of UnigineEditor, choose Tools -> Microprofile.
在UnigineEditor的菜单栏上,选择Tools -> Microprofile。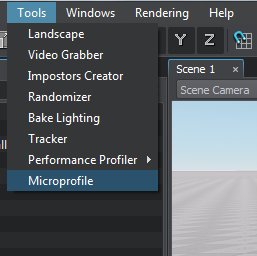

The performance data will be displayed in your Web browser.性能数据将显示在您的Web浏览器中。
- You can display only a part of the profiled frames: in the Web browser address bar, add /<number_of_frames> to the current URL.You can display only a part of the profiled frames: in the Web browser address bar, add /<number_of_frames> to the current URL.
- Don't forget to refresh (F5) the page in the Web browser while the profiling data is collected as it is not performed automatically.Don't forget to refresh (F5) the page in the Web browser while the profiling data is collected as it is not performed automatically.
For example, if you specify localhost:1337/100, only the first 100 frames will be displayed.例如,如果指定localhost:1337/100,则仅显示前100帧。
使用文件可视化#
要将性能数据输出到HTML文件,请执行以下操作:
- 在控制台中,通过 microprofile_dump_frames 控制台命令设置要分析的帧数。您可以跳过此步骤:默认情况下,将分析 1000 个帧。
- 如果需要,请禁用 GPU配置文件。
- 运行 microprofile_dump_html 控制台命令。
性能数据将保存到指定的.html文件。
使用性能分析转储可简化捕获性能“峰值”:即使在焦点未对准的情况下,引擎仍继续在后台渲染应用程序,因此在使用Web服务器提高性能的情况下可以覆盖发生峰值的帧数据可视化。也可以用来估计优化结果:您可以在优化前后转储帧并进行比较。
Performance Data性能数据#
The Microprofile visualizes the detailed per frame performance data on the operations performed by the engine on CPU and GPU and on the engine threads. In the Microprofile main menu, you can change the visialization mode: click Mode and choose the required one. By default, the Detailed mode is set. Microprofile可视化引擎在CPU和GPU(如果启用了 )以及引擎线程上执行的操作的每帧详细性能数据。在Microprofile主菜单中,您可以更改可视化模式:单击Mode并选择所需的模式。默认情况下,设置为Detailed模式。
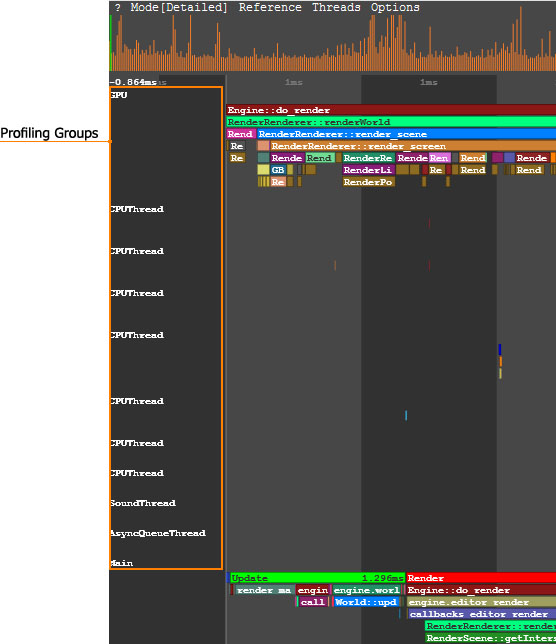
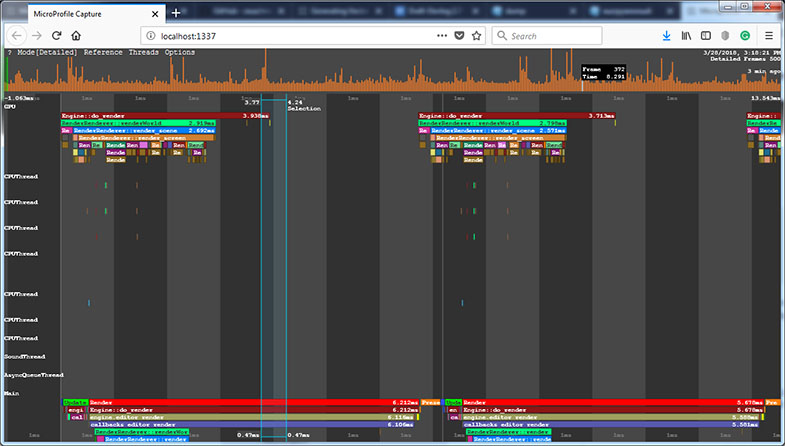
In the Detailed mode, each operation (function) and thread is displayed as a separate colored region. The regions are hierarchical: the function called by the other function is displayed under the last one. The size of the region is determined by the time the corresponding operation takes.在Detailed模式下,每个操作(功能)和线程均显示为单独的彩色区域。区域是分层的:另一个功能调用的功能显示在最后一个功能下方。区域的大小取决于相应操作所花费的时间。
In the picture below, the Engine::do_render() function calls the RenderRenderer::renderWorld() functions and so on:在下图中,Engine::do_render()函数调用RenderRenderer::renderWorld()函数,依此类推:

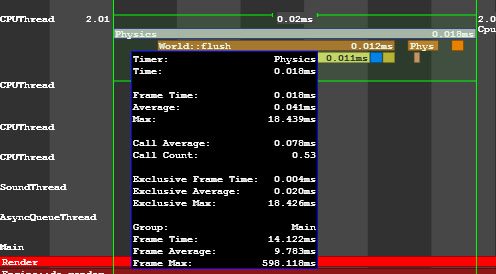
To view the data on a certain operation or a thread, point to the corresponding region. To zoom in/out the displayed regions, scroll the mouse wheel.要在某个操作或线程上查看数据,请指向相应的区域。要放大/缩小显示的区域,请滚动鼠标滚轮。
CPU DataCPU数据#
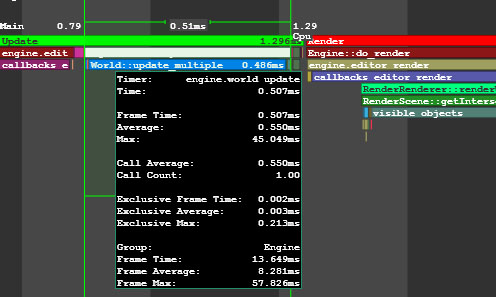
In the Main group of the performance data, the call stack of the operations (e.g., update, rendering, etc.) performed by the engine on CPU is displayed.在性能数据的Main组中,显示引擎在CPU上执行的操作的调用堆栈(例如update, rendering等)。
GPU DataGPU数据#
In the GPU group of the performance data, the call stack of the operations performed by the engine on GPU is displayed. In addition to the main performance data, for each function (e.g. environment rendering, post materials rendering and so on), the number of DIP calls and rendered triangles is shown. Also there can be the number of surfaces, lights, shadows rendered by this function, the number of materials and shaders used; the information on the node or material for which the function is called (identifier, name, etc.).性能数据的 GPU 组中,显示了引擎在GPU上执行的操作的调用堆栈。除了主要性能数据以外,对于每个功能(例如环境渲染,后期材质渲染等),还会显示DIP调用和渲染的三角形的数量。还可以有此功能渲染的表面,灯光,阴影的数量,所使用的材质和着色器的数量。有关调用该函数的节点或材料的信息(标识符,名称等)。
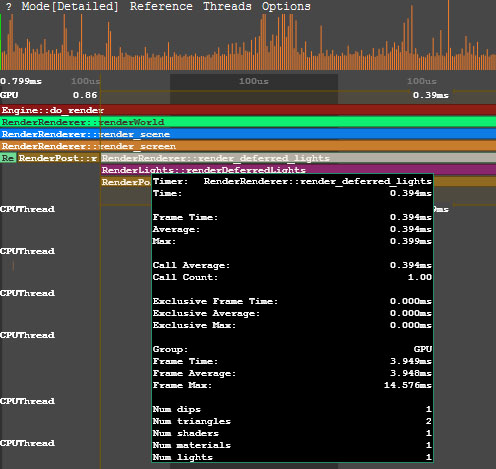
When the region that corresponds to the certain function is pointed, the Microprofile displays when this function is called on CPU and how much time is spent on its performing. 指向与某个功能对应的区域时,将在CPU上调用此功能以及执行该功能所花费的时间时显示Microprofile。
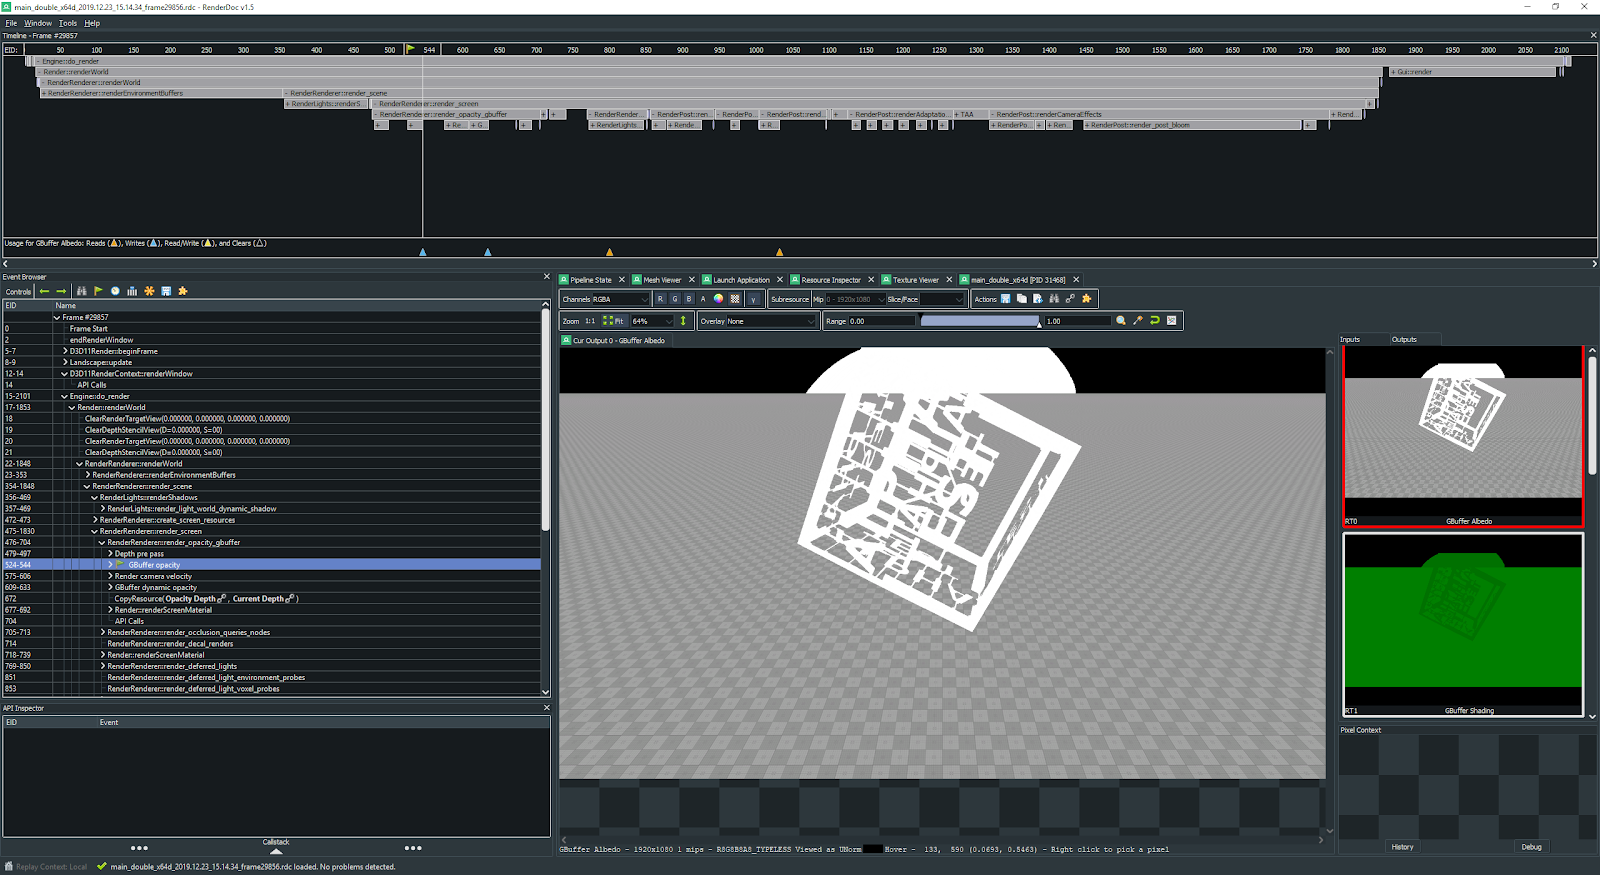
OpenGL or DirectX commands can be combined into GPU Debug groups that are created automatically when defining a profiling scope. All graphic resources loaded from external files, such as textures, shaders, static or skinned meshes, as well as the Engine's internal resources, have their own debug names to simplify identification. This information can be useful when using Graphics API debuggers, such as NVIDIA Nsight or RenderDoc. OpenGL或DirectX命令可以组合到在定义概要分析范围时自动创建的GPU调试组。从外部文件加载的所有图形资源(例如纹理,着色器,静态或蒙皮的网格物体)以及引擎的内部资源均具有自己的调试名称,以简化识别。使用Graphics API调试器(例如NVIDIA Nsight或RenderDoc)时,此信息可能很有用。
Engine Threads Data引擎线程数据#
The performance data on the engine threads is visualized in the CPUThread, SoundThread, AsyncQueueThread, WorldSpawnMeshClutterThread, WorldSpawnGrassThread groups. 引擎线程上的性能数据在CPUThread, SoundThread, AsyncQueueThread, WorldSpawnMeshClutterThread, WorldSpawnGrassThread组中可视化。
