Texture Profiler
 Big projects with a huge number of assets have to face the optimization stage to improve performance and have acceptable FPS. An overview of the project's bottlenecks is given by Performance Profiler. However, Memory consumption displayed there is just a figure, and optimization activities need more details.拥有大量资产的大型项目必须面对优化阶段,以提高性能并拥有可接受的FPS。 Performance Profiler给出了项目瓶颈的概述。但是,这里显示的内存消耗只是一个数字,优化活动需要更多细节。
To clearly understand which assets can be optimized or deleted, Texture Profiler is used. Using this tool, you can see how much memory every texture used in the project takes, easily find it in Asset Browser, and delete or resize it. Texture Profiler also allows checking the texture resolution and sorting by memory size.为了清楚地了解可以优化或删除的资产,使用了Texture Profiler。使用此工具,您可以查看项目中使用的每个纹理占用的内存,可以在Asset Browser中轻松找到它,然后删除或调整其大小。 Texture Profiler还允许检查纹理分辨率并按内存大小排序。
Using Texture Profiler使用纹理剖析器#
To open the Texture Profiler window, choose Tools -> Texture Profiler on the Menu Bar of UnigineEditor.要打开Texture Profiler窗口,请在UnigineEditor的菜单栏上选择Tools -> Texture Profiler。
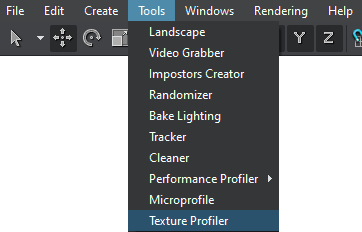
The Texture Profiler window will open.将打开Texture Profiler窗口。
Available Options可用选项#
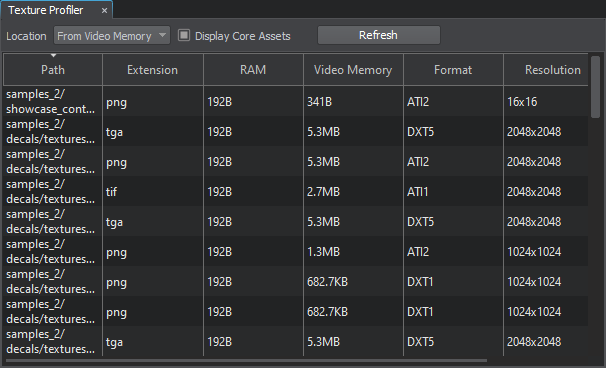
| Location |
From Video Memory — lists only the textures that are currently loaded to the video memory, i. e. with the state "loaded". From Viewport — lists only the textures displayed in the Editor viewport at the moment, i. e. with the state "loaded", Texture Memory Limit = 0, and Destroy Duration = 1. From Video Memory —仅列出当前加载到视频内存的纹理,即。 From Viewport —仅列出当前在“编辑器”视口中显示的纹理,即。状态为“已加载”,Texture Memory Limit = 0, and Destroy Duration = 1. |
|---|---|
| Display Core Assets | Enables or disables displaying of assets from the core/ folder.启用或禁用core/文件夹中资产的显示。 |
Texture Profiler allows sorting by path, extension, occupied RAM or Video Memory size, format or resolution. By clicking any texture in Texture Profiler, you open it in the Asset Browser; by right-clicking, you can check for connections between assets. Texture Profiler允许按路径,扩展名,占用的RAM或视频内存的大小,格式或分辨率进行排序。通过单击Texture Profiler中的任何纹理,可以在 Asset Browser 中打开它;右键单击,可以检查资产之间的连接。