Texture Profiler
Big projects with a huge number of assets have to face the optimization stage to improve performance and have acceptable FPS. An overview of the project's bottlenecks is given by Performance Profiler. However, Memory consumption displayed there is just a figure, and optimization activities need more details.
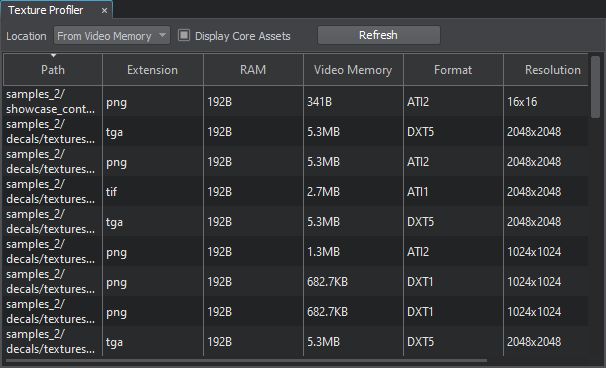
To clearly understand which assets can be optimized or deleted, Texture Profiler is used. Using this tool, you can see how much memory every texture used in the project takes, easily find it in Asset Browser, and delete or resize it. Texture Profiler also allows checking the texture resolution and sorting by memory size.
Using Texture Profiler#
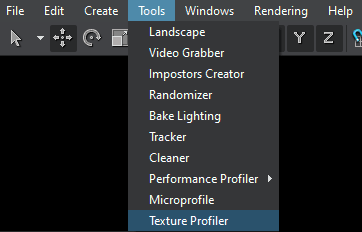
To open the Texture Profiler window, choose Tools -> Texture Profiler on the Menu Bar of UnigineEditor.

The Texture Profiler window will open.
Available Options#

| Location |
From Video Memory — lists only the textures that are currently loaded to the video memory, i. e. with the state "loaded". From Viewport — lists only the textures displayed in the Editor viewport at the moment, i. e. with the state "loaded", Texture Memory Limit = 0, and Destroy Duration = 1. |
|---|---|
| Display Core Assets | Enables or disables displaying of assets from the core/ folder. |
Texture Profiler allows sorting by path, extension, occupied RAM or Video Memory size, format or resolution. By clicking any texture in Texture Profiler, you open it in the Asset Browser; by right-clicking, you can check for connections between assets.