分析纹理

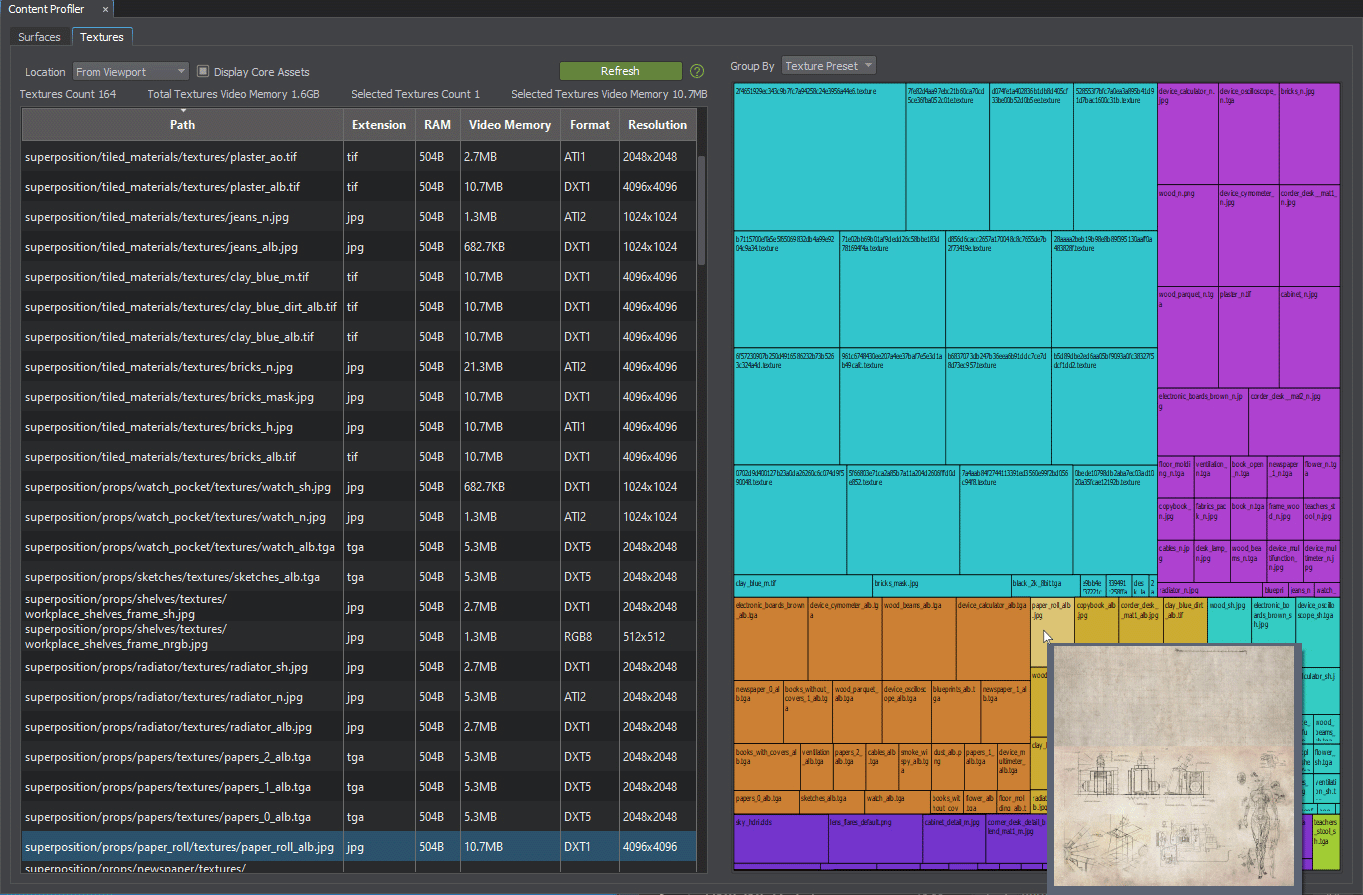
The Textures tab of Content Profiler allows monitoring textures, checking the amount of video memory consumed by them, and easily looking up them in the project for editing.Content Profiler 的 Textures 选项卡允许监控表面,检查它们消耗的视频内存量,并在项目中轻松查找它们以进行编辑。
Available Options可用选项#

| Location |
From Video Memory — lists only the textures that are currently loaded to the video memory, i. e. with the state "loaded". From Viewport — lists only the textures displayed in the Editor viewport at the moment, i. e. with the state "loaded", Texture Memory Limit = 0, and Destroy Duration = 1. From Video Memory —仅列出当前加载到视频内存的纹理,即。 From Viewport —仅列出当前在“编辑器”视口中显示的纹理,即。状态为“已加载”,Texture Memory Limit = 0, and Destroy Duration = 1. |
|---|---|
| Display Core Assets | Enables or disables displaying of assets from the core/ folder.启用或禁用core/文件夹中资源的显示。 |
Texture profiling allows sorting by path, extension, occupied RAM or Video Memory size, format or resolution. By clicking any texture in the Content Profiler, you open it in the Asset Browser; by right-clicking, you can check for connections between assets. 纹理分析允许按路径,扩展名,占用的RAM或视频内存的大小,格式或分辨率进行排序。通过单击Content Profiler中的任何纹理,可以在 Asset Browser 中打开它;右键单击,可以检查资源之间的连接。
Video Tutorial视频教程#
Watch the video below to learn how to work with the Texture Profiler.观看下面的视频,学习如何使用纹理分析:
最新更新:
2023-06-23
Help improve this article
Was this article helpful?
(or select a word/phrase and press Ctrl+Enter)
