Инструмент Microprofile
 UNIGINE has support for Microprofile, an advanced external embeddable CPU/GPU profiler with support for per-frame inspection. UNIGINE поддерживает Microprofile, расширенный внешний встраиваемый профилировщик CPU / GPU с поддержкой покадровой проверки.
Microprofile Tool Инструмент Microprofile The profiler features the following: Профилировщик имеет следующее:
- Profiling operations performed by the engine on CPU and GPU. Операции профилирования, выполняемые движком на CPU и GPU.
- Profiling the engine threads. Профилирование потоков движка.
- Profiling up to 1000 frames. Профилирование до 1000 кадров.
- The performance data output to a local web server. Вывод данных о производительности на локальный веб-сервер или в файл HTML.
Running MicroprofileЗапуск Microprofile#
The Microprofile tool is available only for the Development builds of UNIGINE Engine: it won't be compiled for the Debug and Release ones. You can use the microprofile_info console command to check if the Microprofile is compiled. Инструмент Microprofile доступен только для Development сборок движка: он не будет компилироваться для сборок Debug и Release. Вы можете использовать консольную команду microprofile_info, чтобы проверить, скомпилирован ли Microprofile.
The performance data obtained by the Microprofile can be output to a local web server.Данные о производительности, полученные Microprofile могут выводиться на локальный веб-сервер или в файл HTML.
The Microprofile shows valid information only after the first 1000 frames are rendered (e.g. at the framerate of 60 FPS, such "warmup" time comprises about 16 seconds). Microprofile показывает действительную информацию только после рендеринга первых 1000 кадров (например, при частоте кадров 60 кадров в секунду такое время "разогрева" составляет около 16 секунд).Enabling and Disabling MicroprofileВключение и отключение Microprofile#
Microprofile is performance-consuming, that's why we recommend you to enable it only when you work with it and keep disabled otherwise.Microprofile отнимает много времени, поэтому мы рекомендуем вам включать его только при работе с ним и оставлять отключенным в противном случае.
One way to disable Microprofile is to untick the corresponding option before running UnigineEditor or the application:Один из способов отключить Microprofile - снять флажок с соответствующей опции перед запуском UnigineEditor или приложения :

Another way is to use the microprofile_enabled console command.Другой способ - использовать консольную команду microprofile_enabled.
If you change the Microprofile status via the console, this setting is saved in the <Project_Name>/data/configs/default.user file. The state set in the user configuration file will override the state defined via SDK Browser.Если вы измените статус Microprofile через консоль, эта настройка будет сохранена в файле <Project_Name>/data/configs/default.user. Состояние, заданное в файле конфигурации пользователя, переопределит состояние, определенное через SDK Browser.Visualization Using Built-In ServerВизуализация с использованием встроенного сервера#
To visualize the performance data using the local web server, perform the following: Чтобы визуализировать данные о производительности с помощью локального веб-сервера, выполните следующие действия:
- In the console, set the the number of frames to be profiled via the microprofile_webserver_frames console command. You can skip this step: by default, 500 frames will be profiled. В консоли установите количество кадров для профилирования с помощью консольной команды microprofile_webserver_frames . Вы можете пропустить этот шаг: по умолчанию будет профилировано 500 кадров.
- On the Menu Bar of UnigineEditor, choose Tools -> Microprofile.
В строке меню UnigineEditor выберите Tools -> Microprofile.
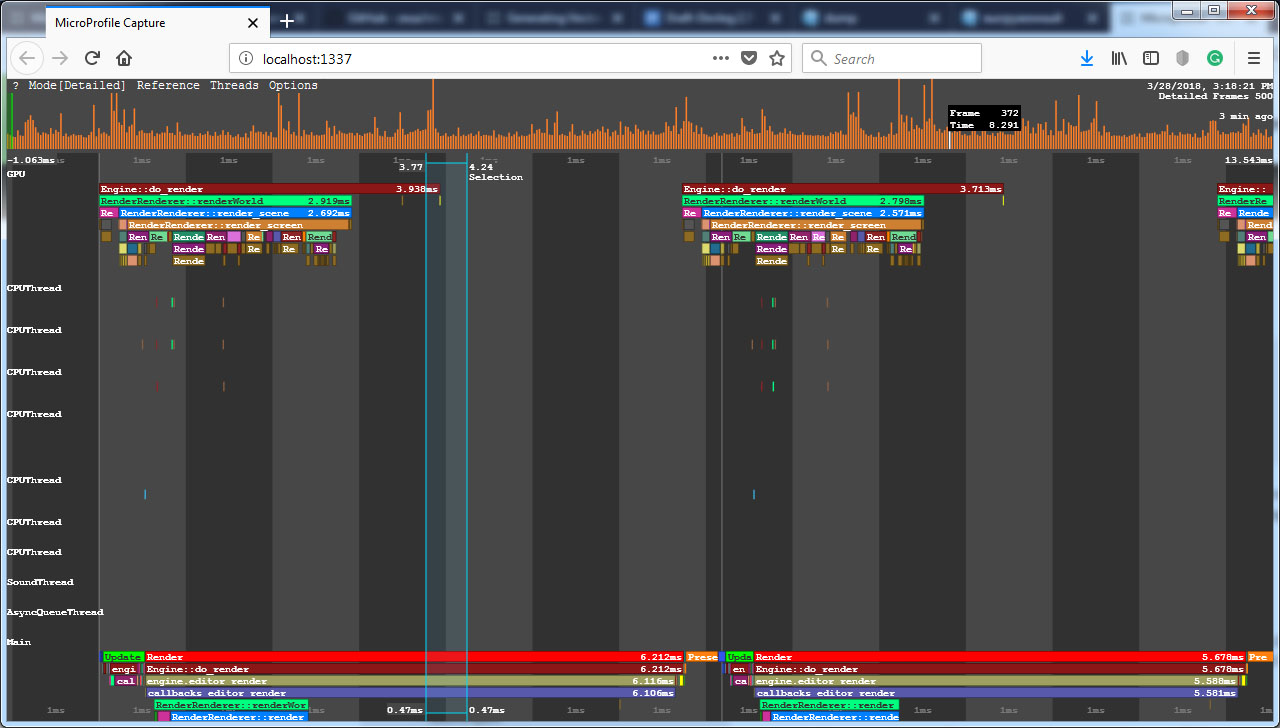
The performance data will be displayed in your Web browser. Данные о производительности будут отображаться в вашем веб-браузере.
- You can display only a part of the profiled frames: in the Web browser address bar, add /<number_of_frames> to the current URL.Вы можете отобразить только часть профилированных кадров: для этого в адресной строке веб-браузера добавьте /<number_of_frames> к текущему URL-адресу.
- Don't forget to refresh (F5) the page in the Web browser while the profiling data is collected as it is not performed automatically.Не забудьте обновить (F5) страницу в веб-браузере во время сбора данных профилирования, так как это не выполняется автоматически.
For example, if you specify localhost:1337/100, only the first 100 frames will be displayed. Например, если вы укажете localhost:1337/100, будут отображаться только первые 100 кадров.
All available console commands can be found in the Performance Profiling section of the article on Console. Все доступные консольные команды можно найти в разделе Performance Profiling статьи о Консоли . Performance DataДанные о производительности#
The Microprofile visualizes the detailed per frame performance data on the operations performed by the engine on CPU and GPU and on the engine threads. In the Microprofile main menu, you can change the visialization mode: click Mode and choose the required one. By default, the Detailed mode is set. Microprofile визуализирует подробные данные о производительности для каждого кадра операций, выполняемых движком на CPU и GPU и в потоках движка. В главном меню Microprofile вы можете изменить режим визуализации: нажмите Mode и выберите нужный. По умолчанию установлен режим Detailed.

Profiling Groups Displayed in Detailed Mode Группы профилирования, отображаемые в режиме Detailed In the Detailed mode, each operation (function) and thread is displayed as a separate colored region. The regions are hierarchical: the function called by the other function is displayed under the last one. The size of the region is determined by the time the corresponding operation takes. В режиме Detailed каждая операция (функция) и поток отображаются в виде отдельной цветной области. Регионы являются иерархическими: функция, вызванная другой функцией, отображается под последней. Размер области определяется временем выполнения соответствующей операции.
In the picture below, the Engine::do_render() function calls the RenderRenderer::renderWorld() functions and so on: На рисунке ниже функция Engine::do_render() вызывает функции RenderRenderer::renderWorld() и так далее:
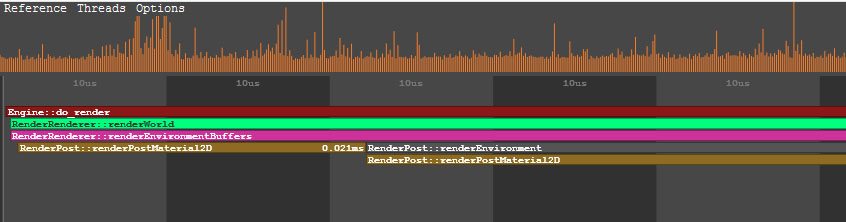
To view the data on a certain operation or a thread, point to the corresponding region. To zoom in/out the displayed regions, scroll the mouse wheel. Чтобы просмотреть данные об определенной операции или потоке, наведите указатель мыши на соответствующую область. Чтобы увеличить / уменьшить отображаемые области, прокрутите колесико мыши.
CPU DataДанные ЦП#
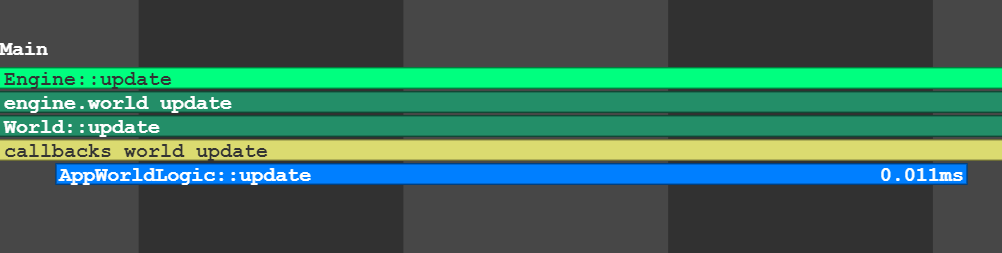
In the Main group of the performance data, the call stack of the operations (e.g., update, rendering, etc.) performed by the engine on CPU is displayed. В группе данных производительности Main отображается стек вызовов операций (например, update, rendering и т. д.), выполняемых движком на ЦП.
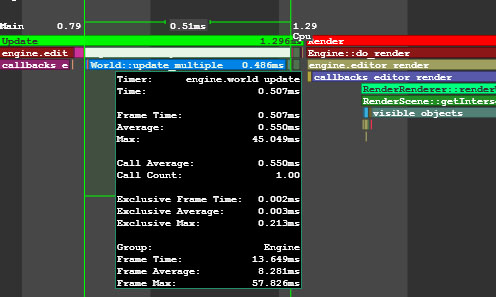
Performance Data on World Update Function Данные о производительности функции World Update GPU DataДанные GPU#
In the GPU group of the performance data, the call stack of the operations performed by the engine on GPU is displayed. In addition to the main performance data, for each function (e.g. environment rendering, post materials rendering and so on), the number of DIP calls and rendered triangles is shown. Also there can be the number of surfaces, lights, shadows rendered by this function, the number of materials and shaders used; the information on the node or material for which the function is called (identifier, name, etc.). В группе данных о производительности GPU отображается стек вызовов операций, выполняемых движком на GPU. В дополнение к основным данным о производительности для каждой функции (например, рендеринга среды, рендеринга пост-материалов и т.д.) отображается количество вызовов DIP и визуализированных треугольников. Также может отображаться количество поверхностей, источников света, теней, отрендеренных этой функцией, количество используемых материалов и шейдеров; информация об узле или материале, для которого вызывается функция (идентификатор, имя и т.д.).
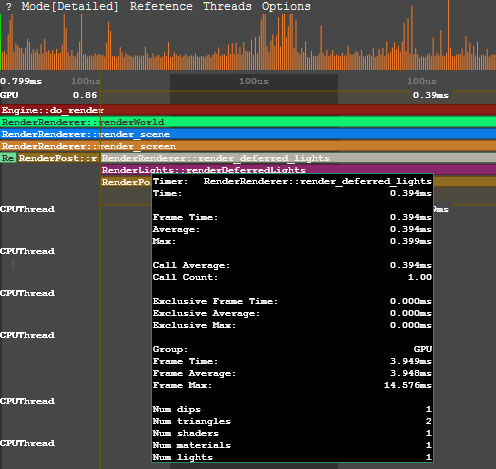
Performance Data on Deferred Lighting Rendering Данные о производительности отложенного рендеринга освещения
When the region that corresponds to the certain function is pointed, the Microprofile displays when this function is called on CPU and how much time is spent on its performing.
Когда указывается область, соответствующая определенной функции, отображается Microprofile, когда эта функция вызывается на CPU и сколько времени затрачивается на ее выполнение.
OpenGL or DirectX commands can be combined into GPU Debug groups that are created automatically when defining a profiling scope. All graphic resources loaded from external files, such as textures, shaders, static or skinned meshes, as well as the Engine's internal resources, have their own debug names to simplify identification. This information can be useful when using Graphics API debuggers, such as NVIDIA Nsight or RenderDoc. OpenGL или команды DirectX можно объединить в группы отладки графического процессора, которые создаются автоматически при определении области профилирования. Все графические ресурсы, загружаемые из внешних файлов, такие как текстуры, шейдеры, статические сетки или сетки со скинами, а также внутренние ресурсы движка имеют свои собственные имена отладки для упрощения идентификации. Эта информация может быть полезна при использовании отладчиков Graphics API, таких как NVIDIA Nsight или RenderDoc.
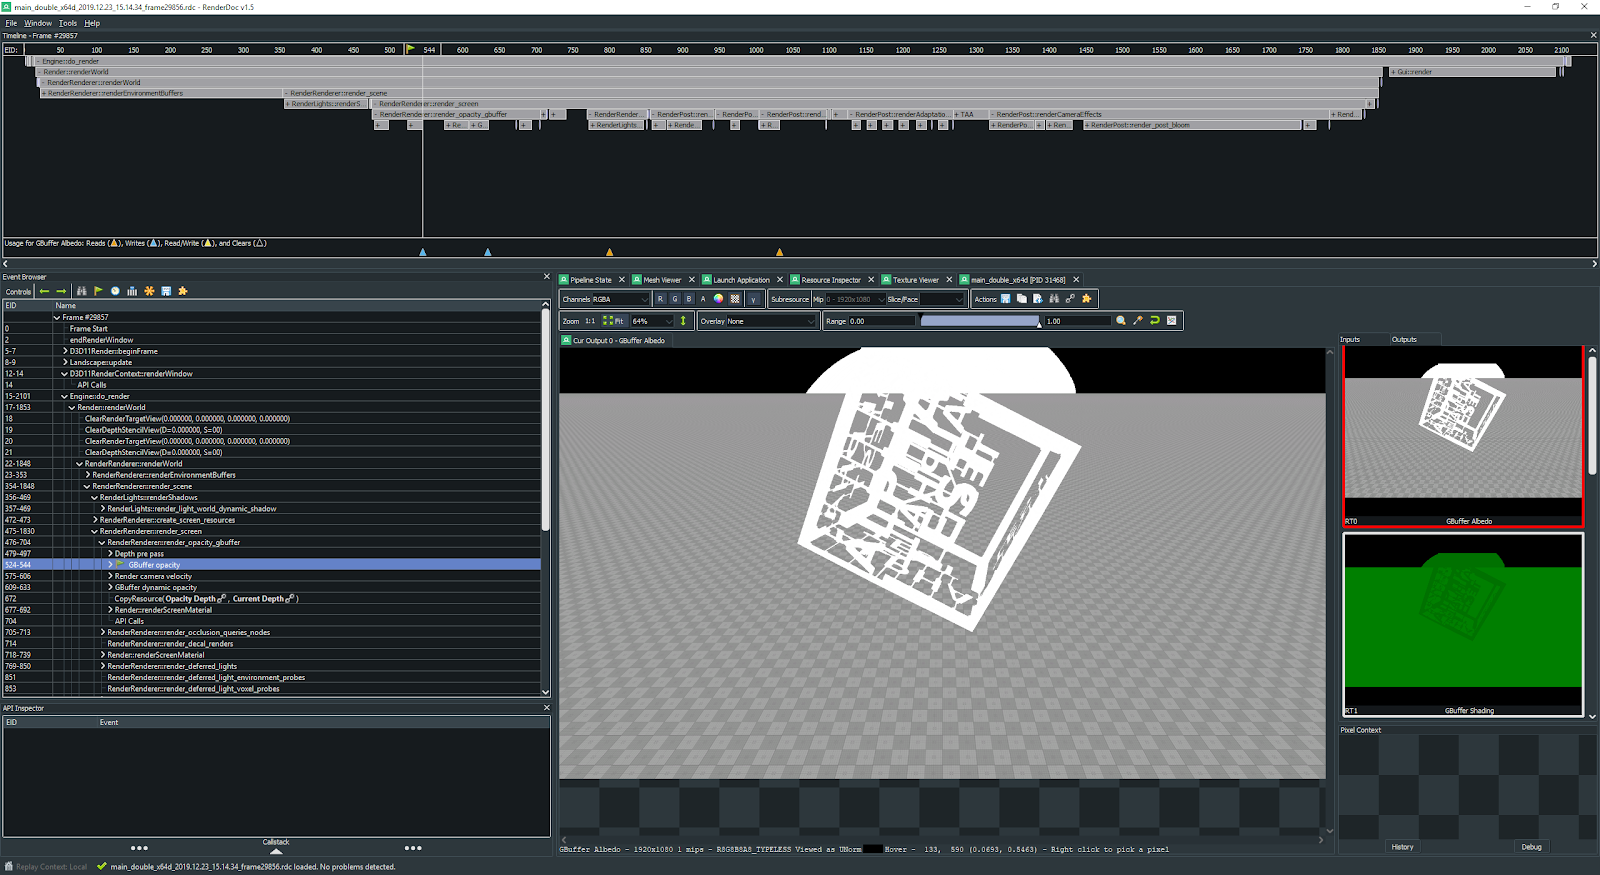
Example of debug data viewed in RenderDoc Пример данных отладки, просматриваемых в RenderDoc Engine Threads DataДанные о потоках движка#
The performance data on the engine threads is visualized in the CPUThread, SoundThread, AsyncQueueThread, WorldSpawnMeshClutterThread, WorldSpawnGrassThread groups.
Данные о производительности потоков движка визуализируются в группах CPUThread, SoundThread, AsyncQueueThread, WorldSpawnMeshClutterThread, WorldSpawnGrassThread.
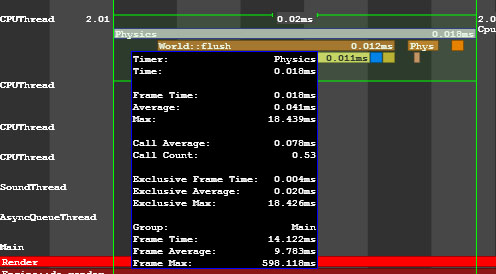
Performance Data on Physics Thread Данные о производительности в потоках симуляции физики Using Microprofile For Application LogicИспользование Microprofile для логики Приложения#
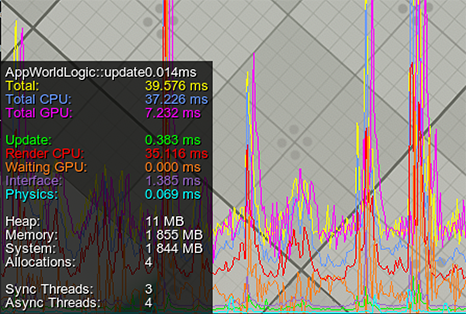
You can use the Microprofile to inspect performance of your application logic.
Вы можете использовать Microprofile для проверки производительности логики вашего приложения.
- Open the source code of your application.Откройте исходный код вашего приложения.
- Include the UnigineProfiler.h file to get access to methods of the Profiler class.Include the UnigineProfiler.h file to get access to methods of the Profiler class.AppWorldLogic.h
#include <UnigineProfiler.h> using namespace Unigine; - Find a function or a scope in the code you want to inspect.Найдите функцию или область видимости в коде, который вы хотите проверить.
-
In the beginning of the function (or the scope), call Profiler::begin(). Specify a name for the capture to be displayed in the Microprofile.В начале функции (или области видимости) вызовите Profiler::begin(). Укажите имя для захвата, которое будет отображаться в Microprofile.ПримечаниеYou can specify the __FUNCTION__ macro to automatically use the class and the function name as the capture.Вы можете указать макрос __FUNCTION__, чтобы автоматически использовать класс и имя функции в качестве захвата.
-
In the end of the function (scope), call Profiler::end().В конце функции (область действия) вызовите Profiler::end().AppWorldLogic.cpp
int AppWorldLogic::update() { // start profiling Profiler::begin("AppWorldLogic::update"); float time = Game::getTime(); float angle_0 = time * 1.0f; float angle_1 = time * 1.5f; float angle_2 = time * 2.0f; light_0->setWorldTransform(translate(Unigine::Math::Vec3(sinf(angle_0), cosf(angle_0), 1.0f) * 20.0f)); light_1->setWorldTransform(translate(Unigine::Math::Vec3(sinf(angle_1), cosf(angle_1), 1.0f) * 20.0f)); light_2->setWorldTransform(translate(Unigine::Math::Vec3(sinf(angle_2), cosf(angle_2), 1.0f) * 20.0f)); // stop profiling Profiler::end(); return 1; } - Run the project.Запустите проект.
- Open the console and run the microprofile_enabled 1 command.Откройте консоль и запустите команду microprofile_enabled 1.
- Go to the Microprofile and find the region with the specified name.Перейдите в микропрофиль и найдите регион с указанным названием.
The begin() and end() functions make the profiling scope available for both the Profiler and Microprofile.
Функции begin() и end() делают область профилирования доступной для как профилировщика , так и для Microprofile.
If you want to use Microprofile only, create the counter via the beginMicro() and endMicro() functions.Если вы хотите использовать только Microprofile, создайте счетчик с помощью функций beginMicro() и endMicro().
beginMicro() returns an identifier that should be passed to endMicro(). Thus, several nested counters can be created.beginMicro() возвращает идентификатор, который должен быть передан в endMicro(). Таким образом, может быть создано несколько вложенных счетчиков.int AppWorldLogic::update()
{
// start profiling
int id = Profiler::beginMicro("AppWorldLogic::update");
float time = Game::getTime();
float angle_0 = time * 1.0f;
float angle_1 = time * 1.5f;
float angle_2 = time * 2.0f;
light_0->setWorldTransform(translate(Unigine::Math::Vec3(sinf(angle_0), cosf(angle_0), 1.0f) * 20.0f));
light_1->setWorldTransform(translate(Unigine::Math::Vec3(sinf(angle_1), cosf(angle_1), 1.0f) * 20.0f));
light_2->setWorldTransform(translate(Unigine::Math::Vec3(sinf(angle_2), cosf(angle_2), 1.0f) * 20.0f));
// stop profiling
Profiler::endMicro(id);
return 1;
}Creating Nested Counters for ProfilingСоздание вложенных счетчиков для профилирования#
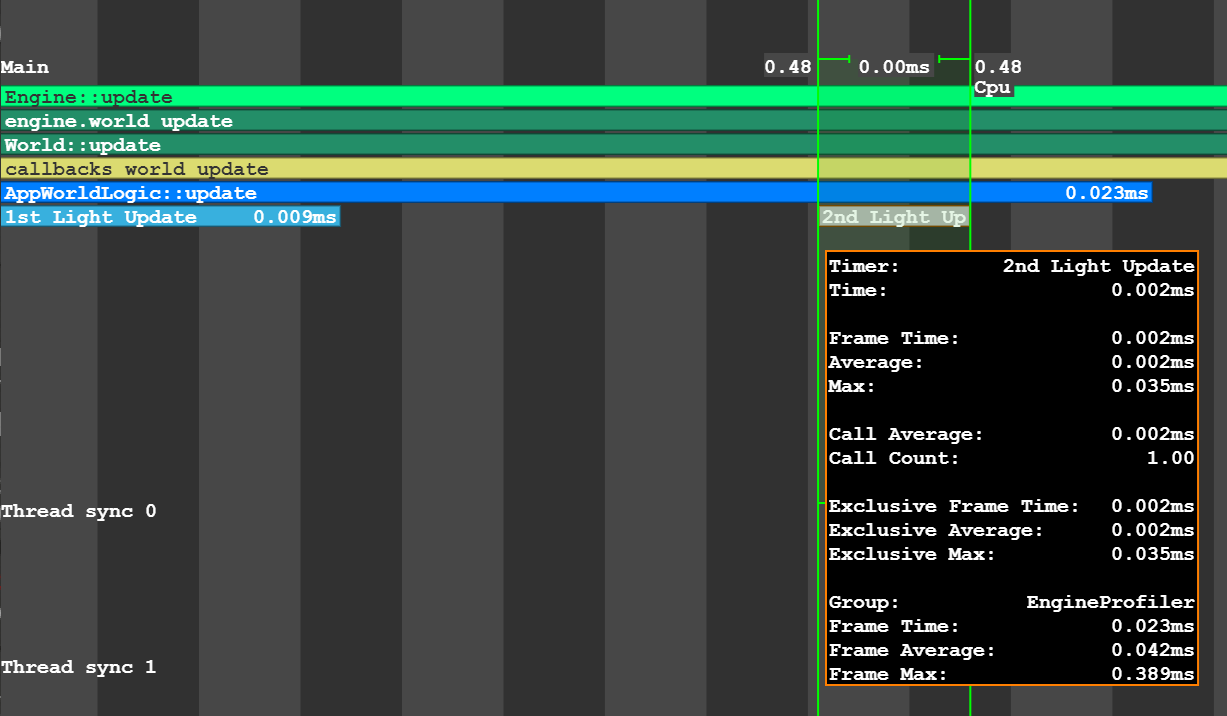
To create several nested counters, you should use the beginMicro() and endMicro() functions. beginMicro() returns an identifier that should be passed to endMicro(). This enables to create nested and intersecting profiler counters.Чтобы создать несколько вложенных счетчиков, вы должны использовать функции beginMicro() и endMicro(). beginMicro() возвращает идентификатор, который должен быть передан в endMicro(). Это позволяет создавать вложенные и пересекающиеся счетчики профилировщика.
In the following example, combination of begin()/end() and beginMicro()/endMicro() is used. So, profiling of the AppWorldLogic::update() function will be available in both the Profiler and the Microprofile.В следующем примере используется комбинация begin()/end() и beginMicro()/endMicro(). Таким образом, профилирование функции AppWorldLogic::update() будет доступно как в профилировщике, так и в микропрофиле.
int AppWorldLogic::update()
{

	// start profiling
	Profiler::begin("AppWorldLogic::update");

	float time = Game::getTime();
	float angle_0 = time * 1.0f;
	float angle_1 = time * 1.5f;
	float angle_2 = time * 2.0f;

	// start profiling of the first light source (available in the Microprofile only)
	int id_0 = Profiler::beginMicro("1st Light Update");

	light_0->setWorldTransform(translate(Unigine::Math::Vec3(sinf(angle_0), cosf(angle_0), 1.0f) * 20.0f));

	// stop profiling of the first light source
	Profiler::endMicro(id_0);

	// start profiling of the second light source (available in the Microprofile only)
	int id_1 = Profiler::beginMicro("2nd Light Update");

	light_1->setWorldTransform(translate(Unigine::Math::Vec3(sinf(angle_1), cosf(angle_1), 1.0f) * 20.0f));

	// stop profiling of the second light source
	Profiler::endMicro(id_1);

	light_2->setWorldTransform(translate(Unigine::Math::Vec3(sinf(angle_2), cosf(angle_2), 1.0f) * 20.0f));

	// stop profiling
	Profiler::end();

	return 1;
}
Profiling Logic Using MacrosЛогика профилирования с использованием макросов#
There are special macros to mark fragments of your code that should be inspected. They can be used instead of the beginMicro() and endMicro() functions:Существуют специальные макросы для обозначения фрагментов вашего кода, которые следует проверить. Их можно использовать вместо функций beginMicro() и endMicro():
-
UNIGINE_PROFILER_FUNCTION to inspect performance of the function.UNIGINE_PROFILER_FUNCTION для проверки работоспособности функции.
Using Macro Using Functions Исходный код (C++)void myFunction() { UNIGINE_PROFILER_FUNCTION; // your function code }Исходный код (C++)void myFunction() { int id = Profiler::beginMicro(__FUNCTION__); // your function code Profiler::endMicro(id); } -
UNIGINE_PROFILER_SCOPED to inspect only a certain part of the code.UNIGINE_PROFILER_SCOPED для проверки только определенной части кода.
Using Macro Using Functions Исходный код (C++)void myFunction() { // your function code { UNIGINE_PROFILER_SCOPED("Scope name"); // your function code } }Исходный код (C++)void myFunction() { // your function code { int id = Profiler::beginMicro("Scope name"); // your function code Profiler::endMicro(id); } }