Profiling Textures

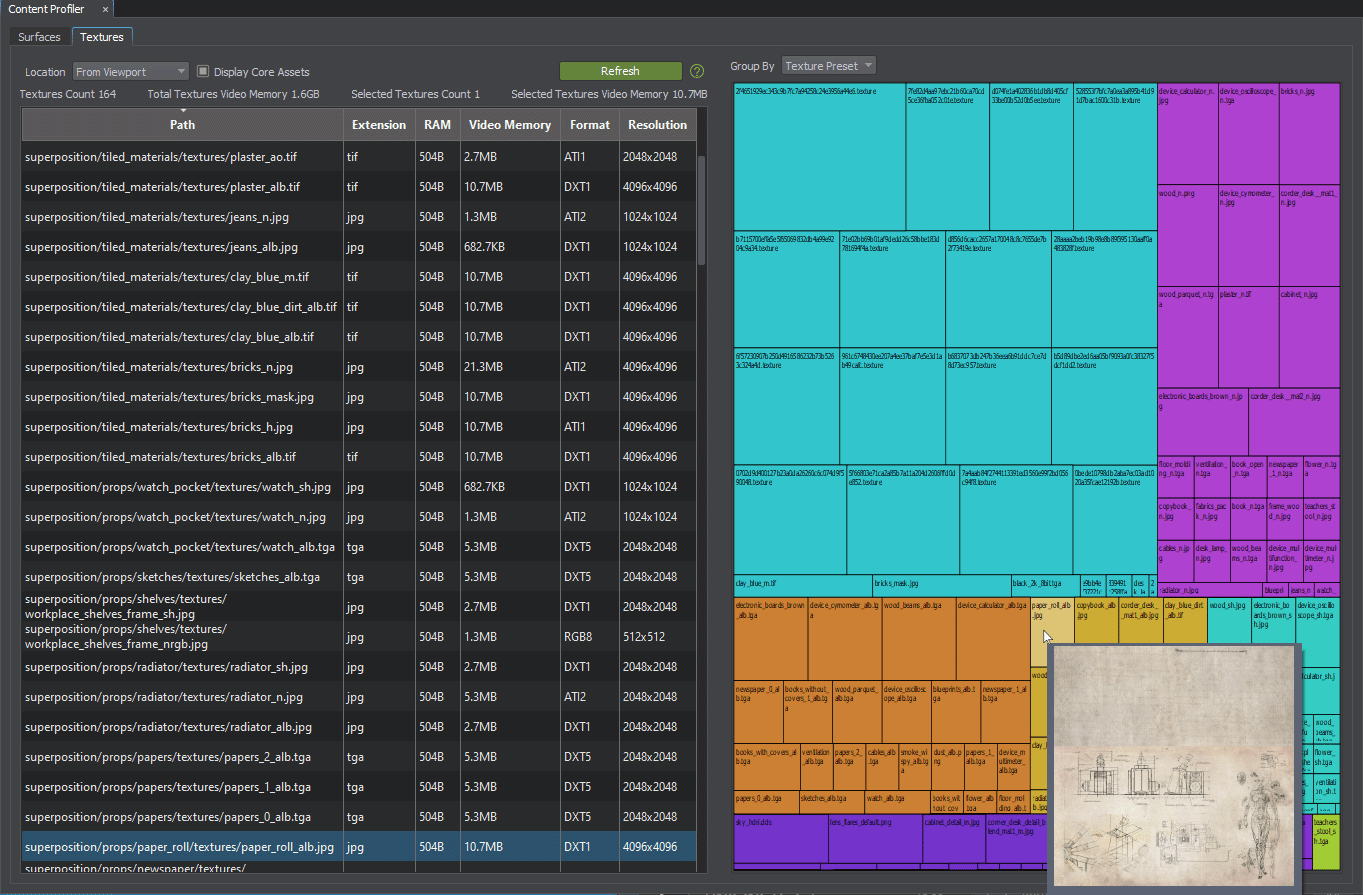
The Textures tab of Content Profiler allows monitoring textures, checking the amount of video memory consumed by them, and easily looking up them in the project for editing.
Available Options#
| Location |
From Video Memory — lists only the textures that are currently loaded to the video memory, i. e. with the state "loaded". From Viewport — lists only the textures displayed in the Editor viewport at the moment, i. e. with the state "loaded", Texture Memory Limit = 0, and Destroy Duration = 1. |
|---|---|
| Display Core Assets | Enables or disables displaying of assets from the core/ folder. |
Texture profiling allows sorting by path, extension, occupied RAM or Video Memory size, format or resolution. By clicking any texture in the Content Profiler, you open it in the Asset Browser; by right-clicking, you can check for connections between assets.
Video Tutorial#
Watch the video below to learn how to work with the Texture Profiler.
The information on this page is valid for UNIGINE 2.19 SDK.
Last update:
2024-08-16
Help improve this article
Was this article helpful?
(or select a word/phrase and press Ctrl+Enter)