Debugging C# Components
You can inspect the source code of your C# components while your application is running. Debugging of C# code is supported for the following IDEs:
- Visual Studio Code (recommended)
- Microsoft Visual Studio (2019)
You can also make use of logging and console messages for debugging purposes.
Logging and Printing Messages to Console#
Printing messages to the log file and console helps monitoring overall progress of execution of your application and report errors which can be used in debugging. Log class makes it possible to print formatted string messages to the log file and the console.
or do the same via code:
Console.Run("show_messages 1");The code below demonstrates how to print various types of messages:
// auxiliary variables for messages
string file_name = "file.txt";
int ID = 10;

// reporting an error message
Log.Error("Loading mesh: can't open \"{0}\" file\n", file_name);

// reporting a message
Log.Message("-> Added {0} UI elements.\n", ID);

// reporting a warning message
Log.Warning("ID of the \"{0}\" file: {1}.\n", file_name, ID);

// reporting a fatal error message to the log file and closing the application
Log.Fatal("FATAL ERROR reading \"{0}\" file!\n", file_name);
See Also#
- For more information on the console, see Console page.
- For more information on the Log class, see Log class page.
- The video tutorial demonstrating how to print user messages to console using C# Component System.
Debugging in Visual Studio Code#
Visual Studio Code is known for its excellent debugging tools. Built-in debugging support is available for the Node.js runtime, while others are implemented as extensions.
First of all, make sure that C# extension for Visual Studio Code is installed. If not, open the command palette in VS Code (press F1) and run Extensions: Install Extensions. Enter C# in the search box and press Enter. Select the extension and click Install If you have previously installed the C# extension, make sure that you have a recent version. You can check this by opening the command palette (press F1) and running Extensions: Show Installed Extensions.
In VS Code, actually there are two debugging modes handling two different workflows:
- Launch - debugging your application in the IDE, right after buiding and launching it.
- Attach - connecting to an already running instance of your application to debug it.
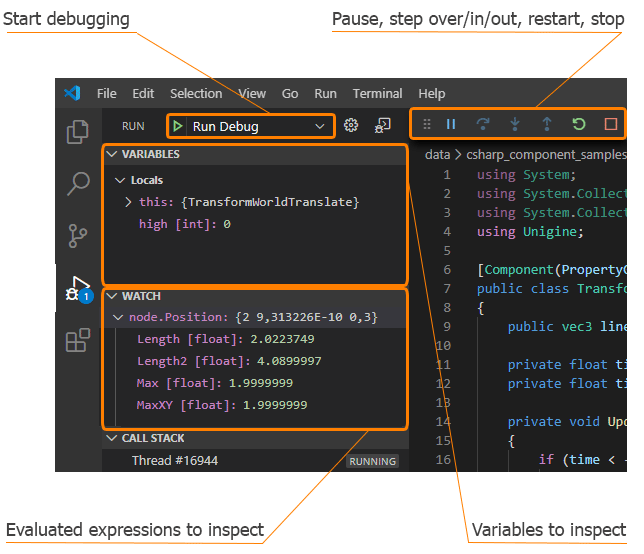
To start debugging you should bring up the Run view first. To do this select the Run icon in the Activity Bar on the side of VS Code or use the keyboard shortcut Ctrl+Shift+D.
Debugging in IDE#
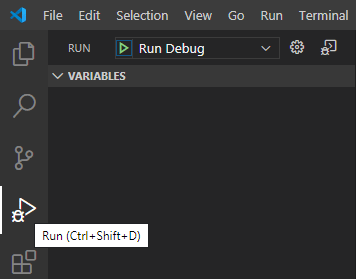
To compile all your components, build your application, and debug it running right from the IDE (without switching to UnigineEditor and clicking the Play button) you should select Run Debug in the Run dropdown:
Now you can add necessary breakpoints and simply hit F5 to launch the debugging process.
By default your application will run with the default world set for your project by the SDK Browser upon creation.
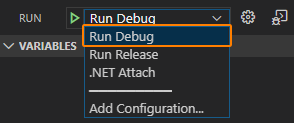
To change or specify the default world, as well as the path to the data folder, or any other startup parameters click the Gear button. This will open the launch.json file containing debugger configuration. Startup parameters of the target application (your project) can be specified in the "args" element.
Debugging via Attaching to Running Application#
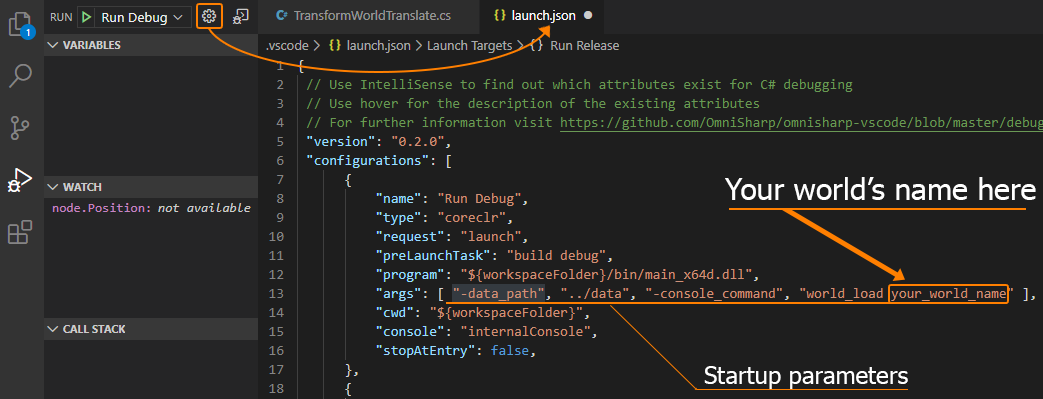
You can also connect VS Code debugger to an instance of your application that is already running - the most common case is launching it via the Play button in the UnigineEditor. In this case you should select .NET Attach in the Run dropdown:
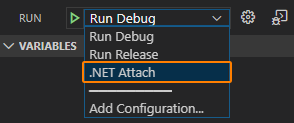
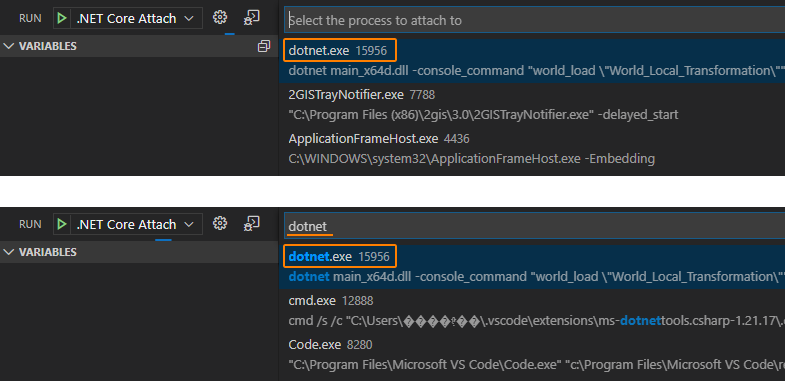
Now you can add necessary breakpoints and simply hit F5 to launch the debugging process. The only difference here is that you should select the application to attach to. You should select the first process in the list named dotnet.exe (type "dotnet" in the search field to find it quickly).
Setting Breakpoints#
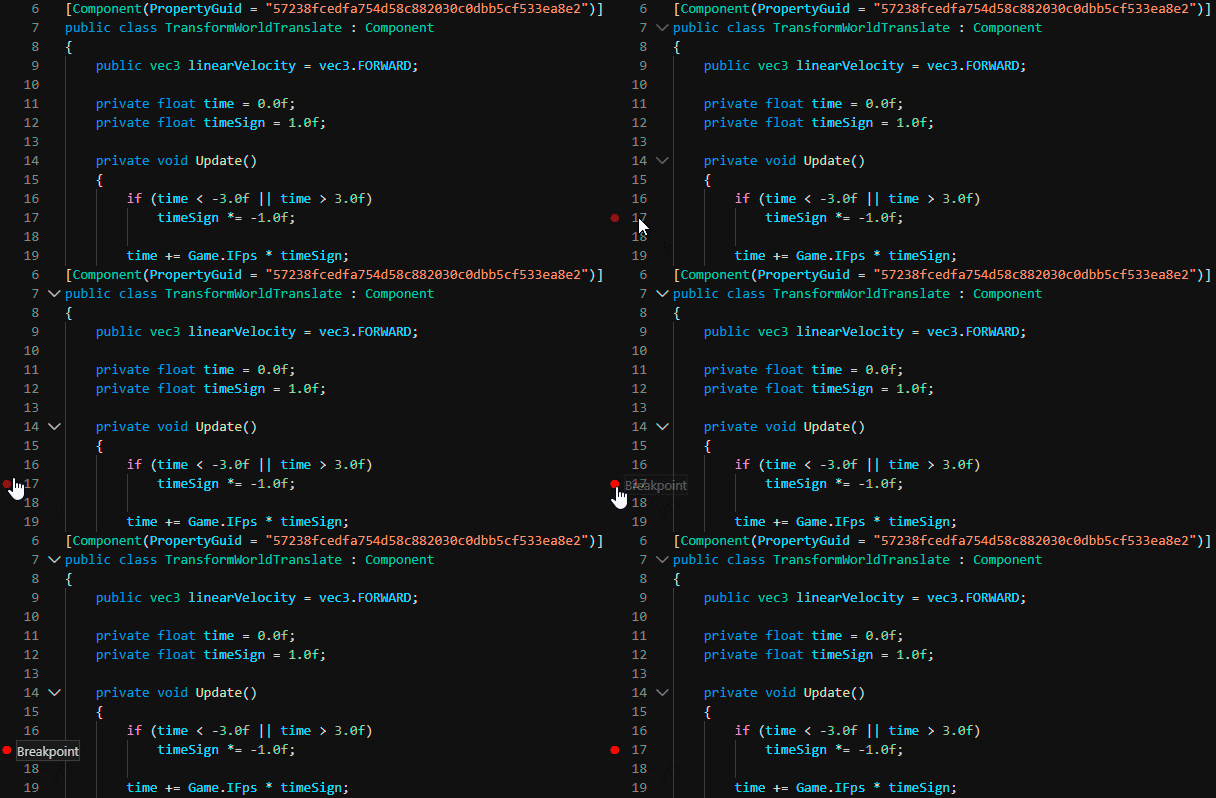
Breakpoints are used to pause your application by stopping execution of your code and giving you a chance to inspect and analyze your program's operation. You can check values of variables, and move step-by-step through your code.
To set up a breakpoint put the cursor to the desired line of your code and press F9 or use the menu.
For more detailed information on debugging in Visual Studio Code please follow this link.
Debugging in Microsoft Visual Studio#
Debugging in IDE#
To compile all your components, build your application, and debug it running right from the IDE (without switching to UnigineEditor and clicking the Play button) you should add necessary breakpoints and simply hit F5 to launch the debugging process.
By default your application will run with the default world set for your project by the SDK Browser upon creation.
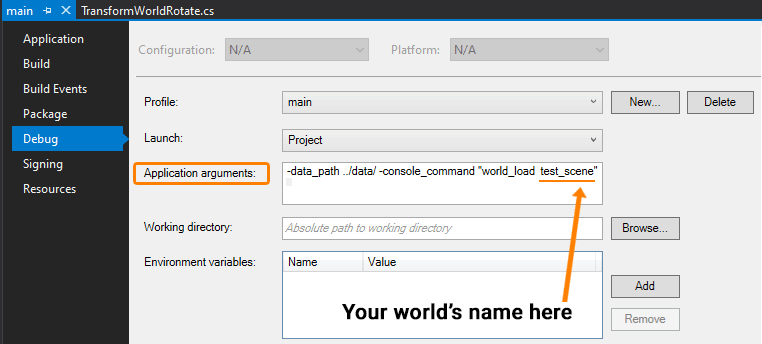
To change or specify the default world, as well as the path to the data folder, or any other startup parameters choose Debug -> your_project_name Properties in the main menu.
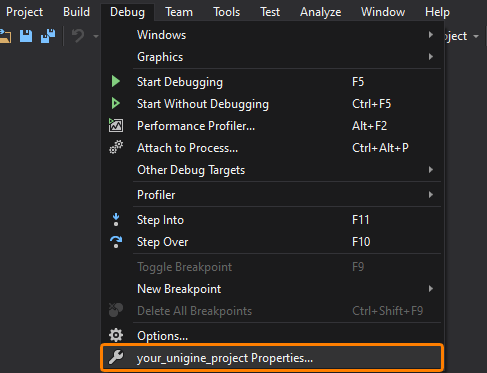
This will open the following window with debugger configuration for your project. Startup parameters of the target application (your project) can be specified in the Application arguments field.
Debugging via Attaching to Running Application#
You can also connect Visual Studio debugger to an instance of your application that is already running - the most common case is launching it via the Play button in the UnigineEditor.
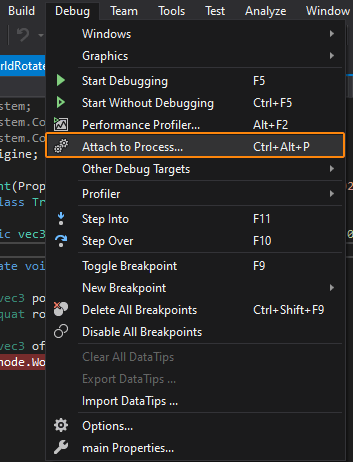
First, you should add necessary breakpoints. Then you can choose Debug -> Attach to Process in the main menu (or hit Ctrl + Alt + P) to launch the debugging process.
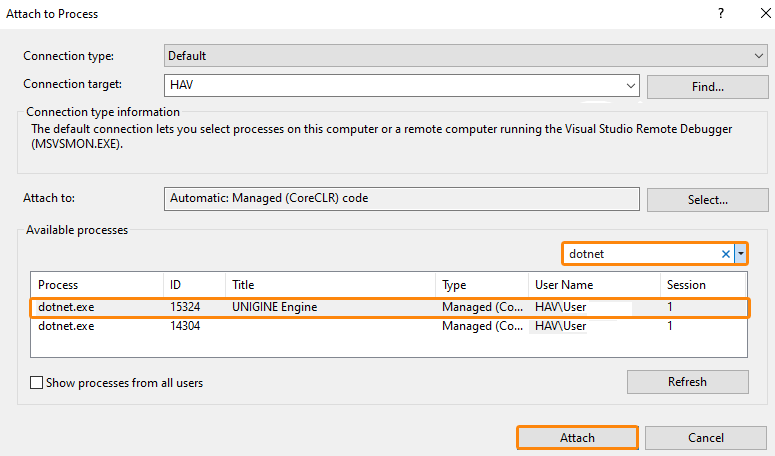
The next thing you should do is select the application to attach to. You should select the first process named dotnet.exe in the Available processes list (type dotnet" in the filter field to find it quickly). Then click Attach.
Setting Breakpoints#
Breakpoints are used to pause your application by stopping execution of your code and giving you a chance to inspect and analyze your program's operation. You can check values of variables, and move step-by-step through your code.
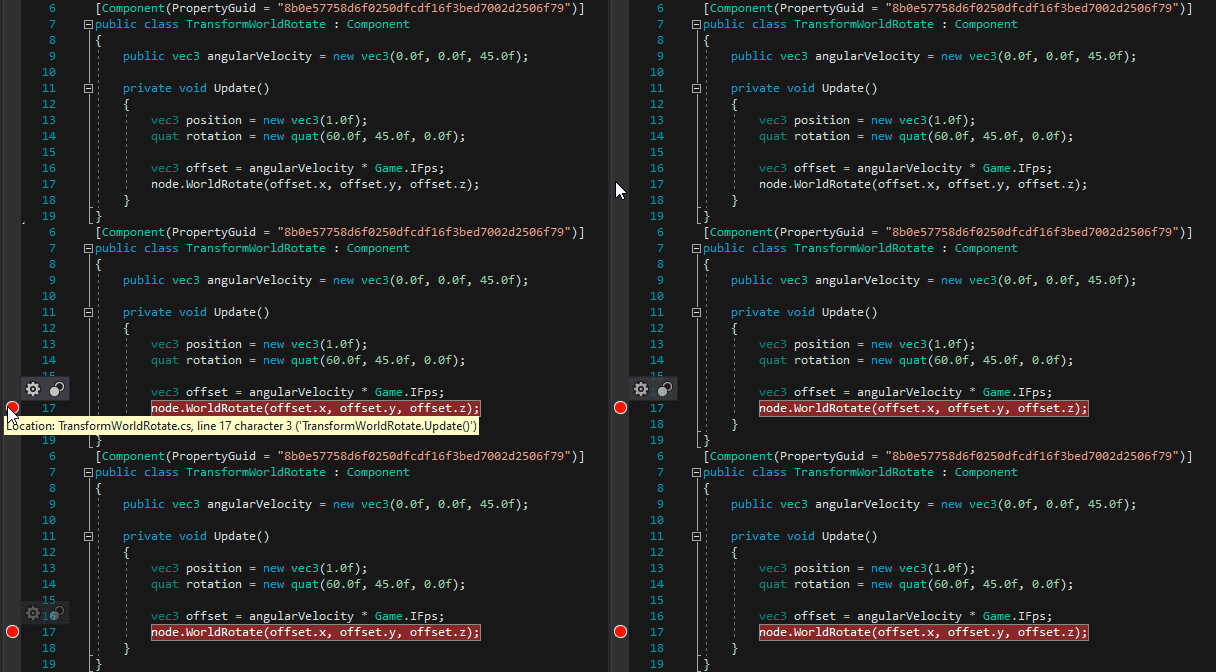
To set up a breakpoint put the cursor to the desired line of your code and press F9 or use the menu.
For more detailed information on debugging in Microsoft Visual Studio please follow this link.
Debugging on Linux#
There is an issue taking place when debugging your application on Linux. After reaching a breakpoint the mouse cursor is grabbed by the Engine making it impossible to switch back to code editor. This section describes a workaround helping you overcome this issue.
The workflow is as follows:
- Insert the following code to AppSystemLogic.cs or to any component's code:
Source code (C#)
public class Debugger { public static void ReleaseMouse() { App.MouseGrab = false; App.MouseCursorHide = false; App.MouseCursorNeedUpdate = true; App.UpdateMouseCursor(); } } - Then we can put a breakpoint anywhere in the code, launch the debug process as described above, and test our application
- After reaching the breakpoint, switch focus to the Debug Console window by hitting Ctrl + Shift + Y on the keyboard
- Type the following line in the console:
Source code (C#)and press Enter
Debugger.ReleaseMouse();

- Mouse cursor is unlocked!
You have to type this only once, then you can perform these actions via hotkeys:
[Ctrl + Shift + Y] -> Arrow_Up -> [Enter] (Visual Studio Code).
The same approach works for other IDEs as well. Each of them has its own "Debug Console", enabling you to execute code when the application is paused. So, you should locate it, open, and execute this code: Debugger.ReleaseMouse();.