Инструменты для оценки производительности
Before you start optimizing anything, you should first evaluate the current performance and identify the bottlenecks of your application.Прежде чем что-либо оптимизировать, сначала нужно оценить текущую производительность и определить узкие места вашего приложения.
Evaluating the application performance, or profiling it, is an important part of the development process. Every time you make any significant changes or additions to your project, you need to check how they affect the application's operation speed. After optimization, it is also important to perform profiling again to evaluate whether the performance metrics have improved.Оценка производительности приложения, или его профилирование, – это важная часть процесса разработки. Каждый раз, внося какие-то существенные изменения или дополнения в проект, вам необходимо проверять, как это повлияло на скорость работы приложения. После оптимизации также важно повторно провести профилирование, чтобы оценить, улучшились ли показатели производительности.
UNIGINE has two main tools for evaluating application performance — performance Profiler and the Microprofile tool.В движке UNIGINE есть два основных инструмента для оценки производительности приложения – это Профилировщик производительности (Profiler) и инструмент Microprofile.
Let's review them in detail.Далее мы расскажем про них более подробно.
ProfilerПрофилировщик производительности (Profiler)#
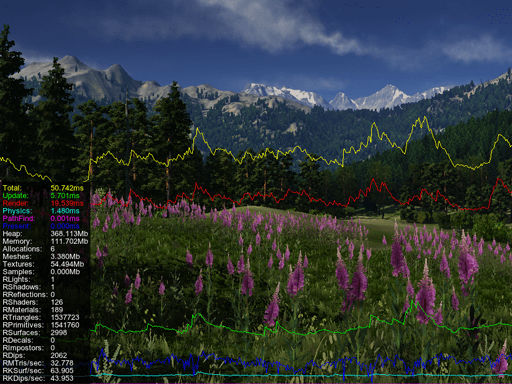
Profiler provides general performance information such as the amount of allocated memory, number of triangles, shaders, and rendering calls. With its help, you can also evaluate which operations take the most time and decide whether you need to optimize your application's content and logic.Итак, Profiler дает общую информацию о производительности, такую как объем выделенной памяти, количество треугольников, шейдеров и вызовов отрисовки. С его помощью вы также можете оценить, на какие операции тратится больше всего времени, и понять, нужно ли оптимизировать контент и логику приложения.
Profiler displays performance data on a timeline. It shows how much time in each frame was spent on updating all the components of your project: how long it took to render nodes, update their states, execute game logic, calculate physics, and so on.Profiler отображает данные о производительности на временной шкале. Он показывает, сколько времени в каждом кадре было затрачено на обновление всех составляющих вашего проекта: сколько времени заняла отрисовка нод, обновление их состояний, выполнение игровой логики, расчет физики и так далее.
For the most performance-consuming operations, such as rendering and calculation of physical interactions, graphs are displayed on the screen. They clearly show the moments of performance drops (so-called spikes), based on which you can identify all bottlenecks.Для самых ресурсоемких операций, таких как рендеринг и расчет физических взаимодействий, на экране отображаются графики. Они наглядно показывают моменты резкого снижения производительности (так называемые спайки, от англ. spike), по ним можно определить все проблемные и узкие места.

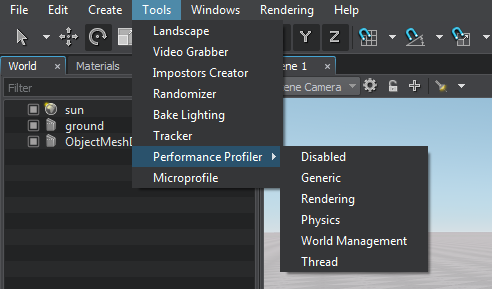
To turn on the profiler, click Tools -> Performance Profiler in the main menu of UnigineEditor and choose the required profiling mode.Чтобы запустить профилировщик, в главном меню UnigineEditor нажмите Tools -> Performance Profiler и выберите необходимый режим профилирования.

Depending on the selected mode, the set of displayed data will differ:В зависимости от выбранного режима будет отличаться набор отображаемых данных:
- Generic profiler shows the general statistics block only. It includes such indicators as total time taken to calculate and render the current frame, time spent on updating the application logic, GPU waiting time, CPU rendering time, GUI rendering time, physics calculations, allocated memory size, as well as the number of synchronous and asynchronous threads. This general statistics block is available in all profiling modes.Generic profiler показывает только блок общей статистики. В него входят такие показатели, как общее время расчета и рендеринга текущего кадра, время, затраченное на обновление логики приложения, время ожидания GPU, процессорное время рендеринга, время рендеринга GUI, выполнения физических расчетов, размер выделенной памяти, а также количество синхронных и асинхронных потоков. Блок с общей статистикой есть в каждом режиме профилирования.
- Rendering profiler shows the detailed rendering statistics and the timeline chart.Rendering profiler показывает подробную статистику рендеринга и временную диаграмму.
- Physics profiler shows the detailed physics-related statistics (within the Physics radius) and the timeline chart.Physics profiler показывает подробную статистику по физике (в пределах Physics radius) и временную диаграмму.
- World Management profiler shows the statistics on the currently loaded virtual world: total number of nodes, physical bodies, and joints, as well as time spent on procedural content creation (e.g. grass and clutters).World Management profiler показывает статистику по виртуальному миру, загруженному в текущий момент: общее количество нод, физических тел и сочленений, а также время, затраченное на создание процедурного контента (например, травы и клаттеров).
- Thread profiler shows the statistics on loading threaded resources: time of asynchronous loading of resources, sounds, as well as asynchronous pathfinding calculations.Thread profiler показывает статистику загрузки потоковых ресурсов: время асинхронной загрузки ресурсов, звуков, а также асинхронных вычислений при поиске пути.
As you can see, there are quite a lot of indicators, so we offer you some tips that may help you to interpret some general statistics values from the Generic profiler:Как видите, показателей довольно много, поэтому мы предлагаем вам несколько советов, которые могут помочь интерпретировать некоторые значения из общей статистики (Generic profiler):
- A high value of the Update indicator may imply that you need to optimize the part of your application logic that is executed every frame. Or it may mean that you need to reduce the number of objects in the scene the state of which is updated every frame (e.g. particle systems, or meshes with skeletal animation).Высокое значение показателя Update может говорить о необходимости оптимизации той части логики вашего приложения, которая выполняется каждый кадр. Или это может означать, что вам необходимо сократить количество объектов в сцене, состояние которых обновляется каждый кадр (например, системы частиц, или меши со скелетной анимацией).
- A high Render CPU value signals that you need to optimize your content. For example, adjust LODs for objects with a large number of polygons, and reduce the number of polygons in models if possible.Высокое значения показателя Render CPU сигнализирует о необходимости оптимизировать контент. Например, настроить LOD-ы для объектов с большим количеством полигонов, а также сократить число полигонов у моделей, если это возможно.
-
The Waiting GPU indicator shows the time between the completion of all calculations on the CPU side and the completion of frame rendering on the GPU side, so it should be used to analyze your application's bottlenecks.Показатель Waiting GPU показывает время между завершением всех вычислений на CPU и завершением отрисовки кадра на GPU, поэтому его следует использовать для анализа узких мест вашего приложения.
- A zero value means that it takes longer to compute a frame on the CPU than it does to render a frame on the GPU, which means that there is a bottleneck on the CPU.Нулевое значение показателя говорит о том, что вычисление кадра на CPU занимает больше времени, чем отрисовка кадра на GPU, что означает наличие узкого места на CPU.
- If the value is high, you should check the frame rate (FPS): if it is low, then the GPU is the limiting factor (i.e. GPU computation is much slower than CPU computation); if it is high enough, then the CPU has free resources that should be used to process more operations in the Update cycle.Если показатель имеет высокое значение, то нужно смотреть на частоту кадров (FPS): если она низкая, то ограничивающий фактор – GPU (т.е. вычисления на GPU выполняются гораздо медленнее, чем на CPU); если же она достаточно высока, значит CPU имеет свободные ресурсы, которые следует использовать для обработки большего количества операций в цикле Update.
- A continuous increase in the Memory indicator value may indicate a memory leak. In this case, you should check whether all created objects and variables are correctly deleted after they are used.Постоянное увеличение показателя Memory может указывать на утечку памяти. В таком случае, нужно проверить, правильно ли удаляются все созданные объекты и переменные после их использования.
The values of the Generic Profiler indicators are also displayed on the graphs, so you can clearly see which of them have changed dramatically at a certain point in time and then analyze their values. The colors of the graph and the corresponding indicator coincide. For example, a spike in the red graph indicates an increase in the Render GPU value, which in turn means that there is "heavy" content in the scene that requires optimization.Значения показателей из раздела общей статистики также отображаются на графиках, поэтому вы наглядно сможете увидеть, какие из них резко изменились в определенный момент времени, и затем уже проанализировать их значения. Цвета графика и соответствующего ему показателя совпадают. Например, резкий скачок красного графика говорит об увеличении значения Render GPU, а это, в свою очередь, означает, что в сцене есть "тяжелый" контент, требующий оптимизации.
Working with MicroprofileРабота с Microprofile#
Microprofile is a tool for collecting and analyzing CPU and GPU performance data that allows you to carry out a detailed frame-by-frame inspection of your application performance.Microprofile – это инструмент сбора и анализа данных о работе процессора и видеокарты, который позволяет выполнять детальную покадровую проверку производительности вашего приложения.

Microprofile can profile up to 1000 frames. It displays performance data on a local web server with the ability to save it as an HTML file.Microprofile может профилировать до 1000 кадров. Он отображает данные о производительности на локальном веб-сервере с возможностью их выгрузки в файл HTML.
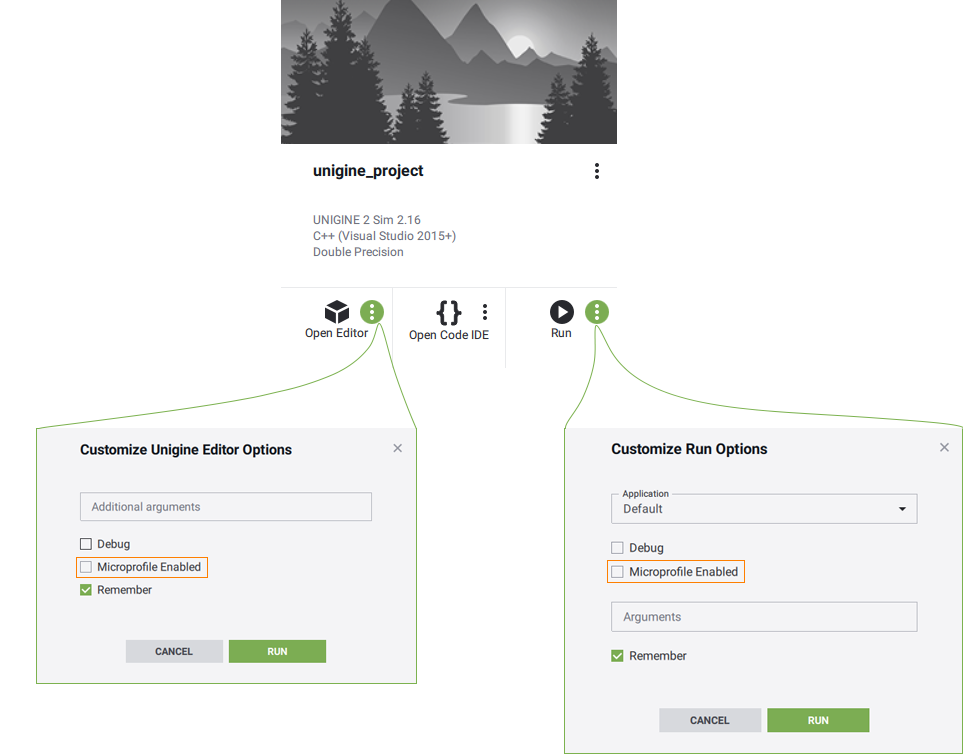
The Microprofile tool is only available for Development builds of the engine: it is not compiled for Debug and Release builds.Инструмент Microprofile доступен только для Development сборок движка: он не компилируется для отладочной (Debug) и релизной (Release) сборок.
You can check if Microprofile is enabled and turn it on using the microprofile_info console command. If it is disabled, you will need to change project settings in UNIGINE SDK Browser and restart the application:Проверить, включен ли Microprofile, и включить его можно через консольную команду microprofile_info. Если он выключен, то вам потребуется изменить настройки проекта в UNIGINE SDK Browser и перезапустить приложение:

Microprofile should only be enabled when you are working with it. If you do not use performance profiling at a certain stage of working with your project, disable this tool.Включать Microprofile следует только при работе с ним. Если на каком-то этапе работы над проектом вы не используете профилирование производительности – отключите этот инструмент.
Visualization Using Built-In ServerВизуализация с использованием встроенного сервера#
The Microprofile tool has a web interface that displays performance data. To open the profiling results in a web browser select Tools → Microprofile in the UnigineEditor main menu. The default duration of the profiled segment is 200 frames, if necessary you can change the number of frames using the microprofile_webserver_frames console command.Инструмент Microprofile имеет веб-интерфейс, в котором отображаются данные о производительности. Чтобы открыть результаты профилирования в веб-браузере выберите Tools → Microprofile в главном меню UnigineEditor. По умолчанию продолжительность профилируемого отрезка составляет 200 кадров, при необходимости можно изменить количество кадров с помощью консольной команды microprofile_webserver_frames.

The performance data will be displayed in your web browser. Microprofile will be available via the link in the address bar while the application is running.Данные о производительности отобразятся в вашем веб-браузере. По ссылке в адресной строке Microprofile будет доступен в течение всего времени работы приложения.
In the address bar, you can also limit the number of displayed frames using “/”: if you set localhost:1337/100, only the first 100 frames will be displayed.Здесь же в адресной строке через “/” можно ограничить количество отображаемых кадров: если указать localhost:1337/100, то будут отображаться только первые 100.
Performance dataДанные о производительности#
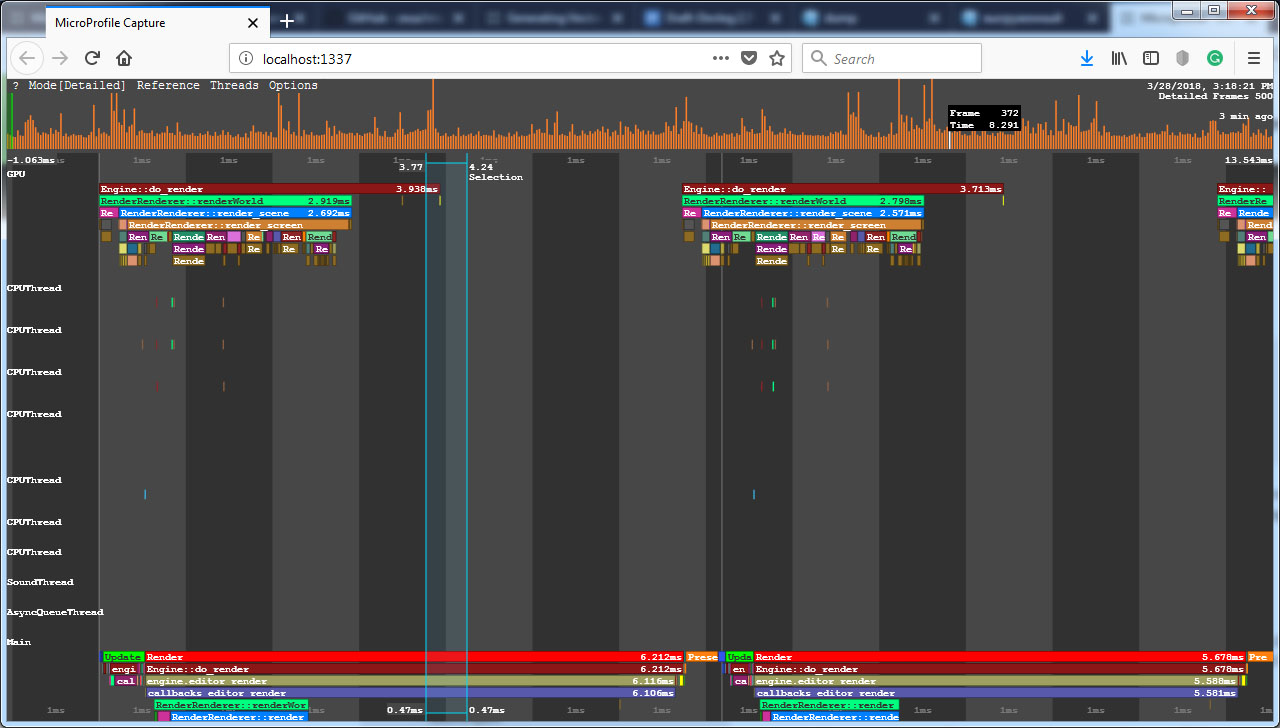
Microprofile visualizes the detailed per frame performance data on operations performed by the engine on CPU and GPU and in the engine threads.Microprofile визуализирует для каждого кадра подробные данные о производительности операций, выполняемых движком на процессоре (CPU), видеокарте (GPU) и в потоках движка.
There are several modes for displaying performance data. You can switch between them in the Microprofile main menu: click Mode and select the desired one. The Detailed mode is set as a default one, as it provides the exhaustive information.Есть несколько режимов для отображения данных о производительности. Переключаться между ними можно в главном меню Microprofile: нажмите Mode и выберите нужный. По умолчанию используется режим Detailed, так как он является самым полным.
In this mode, the interface is divided into two parts:В этом режиме интерфейс разделен на две части:
- Main workspace that contains detailed information about each rendered frame. Each operation (function) and thread is displayed as a separate colored region. The regions are hierarchical: the function is a parent to the function that it calls and is displayed above it. The size of the region is determined by the time the corresponding operation takes. The workspace can be moved and scaled.Основное рабочее пространство, которое содержит детальную информацию по каждому отрисованному кадру. Здесь каждая операция (функция) и поток отображаются в виде отдельного цветного блока. Эти блоки образуют иерархию: функция является родительской по отношению к той функции, которую она вызывает, и отображается над ней. Размер блока определяется временем выполнения соответствующей операции. Рабочее пространство можно двигать и масштабировать.
- Frame sequence that is used to easily navigate through the collected data. Each column is a frame. The column height corresponds to the frame rendering time. If you click on a column, you will quickly switch to the data collected on that frame. The last frames in the sequence provide the most valuable data for performance evaluation.Последовательность кадров, которая используется для удобной навигации по собранным данным. Каждый столбец – это кадр. Высота столбца соответствует времени отрисовки кадра. Если нажать на столбец, то вы быстро переключитесь на данные, собранные по этому кадру. Последние кадры в этой последовательности дают наиболее значимые данные для оценки производительности.

Performance data is displayed horizontally in several threads:Данные о производительности отображаются горизонтально в несколько потоков:
- GPU thread shows the call stack of the operations performed by the engine on GPU.Поток видеокарты (группа GPU). Здесь показан стек вызовов операций, выполняемых движком на GPU.
- Main engine thread show the call stack of the operations (such as update, rendering, etc.) performed on the CPU side.Основной поток движка (группа Main). Здесь показан стек вызовов операций (например, update, rendering и т. д.), которые выполняются на стороне CPU.
- Other engine threads (CPUThread, SoundThread, AsyncQueueThread, WorldSpawnMeshClutterThread, WorldSpawnGrassThread).Остальные потоки движка (CPUThread, SoundThread, AsyncQueueThread, WorldSpawnMeshClutterThread, WorldSpawnGrassThread).
Each frame starts from the update() function.Каждый кадр начинается с функции update().
Profiling Custom CodeПрофилирование пользовательского кода#
You can use the Microprofile to inspect performance of your application logic.Microprofile можно использовать, чтобы проверить насколько быстро работает какой-либо фрагмент вашего кода.
Let's review a simple example. Suppose you have a C# component that moves a node in the scene and enables/disables it depending on its position in the current frame.Давайте рассмотрим простой пример. Предположим, у вас есть C# компонент, который перемещает ноду в сцене и включает/выключает ее в зависимости от позиции в текущем кадре.
To find out how long it takes to execute such logic, you can use the Profiler class methods:Чтобы узнать, сколько времени занимает выполнение такой логики, вы можете использовать методы класса Profiler:
-
At the beginning of the Update() method call Profiler.Begin(). Specify the counter name that will be displayed in Micropofile as its argument. At the end of the method call Profiler.End().В начале метода Update() вызовите Profiler.Begin(). В качестве аргумента укажите имя счетчика, которое будет отображаться в Micropofile, а в конце метода вызовите Profiler.End().
NodeUpdate.csusing System; using System.Collections; using System.Collections.Generic; using Unigine; #if UNIGINE_DOUBLE using Vec3 = Unigine.dvec3; using Vec4 = Unigine.dvec4; using Mat4 = Unigine.dmat4; #else using Vec3 = Unigine.vec3; using Vec4 = Unigine.vec4; using Mat4 = Unigine.mat4; #endif [Component(PropertyGuid = "AUTOGENERATED_GUID")] // <-- идентификатор генерируется автоматически для нового компонента public class NodeUpdate : Component { private void Update() { // начало блока профилирования Profiler.Begin("NodeUpdate Component"); float time = Game.Time; Vec3 pos = new Vec3(MathLib.Sin(time) * 2.0f, MathLib.Cos(time) * 2.0f, 0.0f); // включение/выключение ноды node.Enabled = pos.x > 0.0f || pos.y > 0.0f; // смена позиции ноды node.WorldPosition = pos; // конец блока профилирования Profiler.End(); } } -
Build and run the Release version of the project: open UnigineEditor, select Release in the Configuration field, and then click the Play button.Соберите и запустите релизную версию (Release) проекта: откройте UnigineEditor, в настройках запуска выберите Release в поле Configuration, а затем нажмите кнопку Play.

- Run the microprofile_enabled 1 console command, if Microprofiler hasn't been enabled via SDK Browser yet.В консоли выполните команду microprofile_enabled 1, если Microprofiler не был включен ранее с помощью SDK Browser.
- Open Microprofile in the web browser.Откройте Microprofile в браузере.
-
Find the region with the name you passed to the Profiler.Begin() function. In our example that is "NodeUpdate Component".Найдите регион с именем, которое вы передали в функцию Profiler.Begin(), в нашем примере это будет "NodeUpdate Component".

The Profiler.Begin() and Profiler.End() functions make the code snippet available to both Profiler and Microprofile. If you want to use only Microprofile, use the Profiler.BeginMicro() and Profiler.EndMicro() functions. Note that their calls are different: Profiler.BeginMicro() returns an identifier to be passed to Profiler.EndMicro().Функции Profiler.Begin() и Profiler.End() делают фрагмент кода доступным как для профилировщика производительности Profiler, так и для Microprofile. Если хотите использовать только Microprofile, используйте функции Profiler.BeginMicro() и Profiler.EndMicro(). Обратите внимание, что их вызов отличается: Profiler.BeginMicro() возвращает идентификатор, который должен быть передан в Profiler.EndMicro().
Исходный код (C#)private void Update() { // начало блока профилирования int id = Profiler.BeginMicro("Component Update"); float time = Game.Time; Vec3 pos = new Vec3(MathLib.Sin(time) * 2.0f, MathLib.Cos(time) * 2.0f, 0.0f); // включение/выключение ноды node.Enabled = pos.x > 0.0f || pos.y > 0.0f; // смена позиции ноды node.WorldPosition = pos; // конец блока профилирования Profiler.EndMicro(id); }
Информация, представленная на данной странице, актуальна для версии UNIGINE 2.20 SDK.
