Performance Profiling Tools
Before you start optimizing anything, you should first evaluate the current performance and identify the bottlenecks of your application.
Evaluating the application performance, or profiling it, is an important part of the development process. Every time you make any significant changes or additions to your project, you need to check how they affect the application's operation speed. After optimization, it is also important to perform profiling again to evaluate whether the performance metrics have improved.
UNIGINE has two main tools for evaluating application performance — performance Profiler and the Microprofile tool.
Let's review them in detail.
Profiler#
Profiler provides general performance information such as the amount of allocated memory, number of triangles, shaders, and rendering calls. With its help, you can also evaluate which operations take the most time and decide whether you need to optimize your application's content and logic.
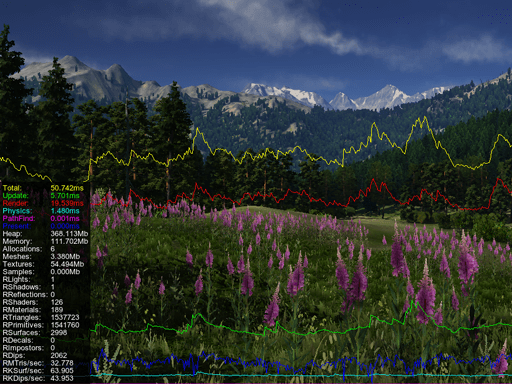
Profiler displays performance data on a timeline. It shows how much time in each frame was spent on updating all the components of your project: how long it took to render nodes, update their states, execute game logic, calculate physics, and so on.
For the most performance-consuming operations, such as rendering and calculation of physical interactions, graphs are displayed on the screen. They clearly show the moments of performance drops (so-called spikes), based on which you can identify all bottlenecks.
To turn on the profiler, click Tools -> Performance Profiler in the main menu of UnigineEditor and choose the required profiling mode.
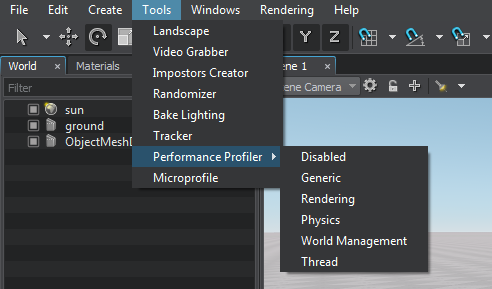
Depending on the selected mode, the set of displayed data will differ:
- Generic profiler shows the general statistics block only. It includes such indicators as total time taken to calculate and render the current frame, time spent on updating the application logic, GPU waiting time, CPU rendering time, GUI rendering time, physics calculations, allocated memory size, as well as the number of synchronous and asynchronous threads. This general statistics block is available in all profiling modes.
- Rendering profiler shows the detailed rendering statistics and the timeline chart.
- Physics profiler shows the detailed physics-related statistics (within the Physics radius) and the timeline chart.
- World Management profiler shows the statistics on the currently loaded virtual world: total number of nodes, physical bodies, and joints, as well as time spent on procedural content creation (e.g. grass and clutters).
- Thread profiler shows the statistics on loading threaded resources: time of asynchronous loading of resources, sounds, as well as asynchronous pathfinding calculations.
As you can see, there are quite a lot of indicators, so we offer you some tips that may help you to interpret some general statistics values from the Generic profiler:
- A high value of the Update indicator may imply that you need to optimize the part of your application logic that is executed every frame. Or it may mean that you need to reduce the number of objects in the scene the state of which is updated every frame (e.g. particle systems, or meshes with skeletal animation).
- A high Render CPU value signals that you need to optimize your content. For example, adjust LODs for objects with a large number of polygons, and reduce the number of polygons in models if possible.
-
The Waiting GPU indicator shows the time between the completion of all calculations on the CPU side and the completion of frame rendering on the GPU side, so it should be used to analyze your application's bottlenecks.
- A zero value means that it takes longer to compute a frame on the CPU than it does to render a frame on the GPU, which means that there is a bottleneck on the CPU.
- If the value is high, you should check the frame rate (FPS): if it is low, then the GPU is the limiting factor (i.e. GPU computation is much slower than CPU computation); if it is high enough, then the CPU has free resources that should be used to process more operations in the Update cycle.
- A continuous increase in the Memory indicator value may indicate a memory leak. In this case, you should check whether all created objects and variables are correctly deleted after they are used.
The values of the Generic Profiler indicators are also displayed on the graphs, so you can clearly see which of them have changed dramatically at a certain point in time and then analyze their values. The colors of the graph and the corresponding indicator coincide. For example, a spike in the red graph indicates an increase in the Render GPU value, which in turn means that there is "heavy" content in the scene that requires optimization.
Working with Microprofile#
Microprofile is a tool for collecting and analyzing CPU and GPU performance data that allows you to carry out a detailed frame-by-frame inspection of your application performance.
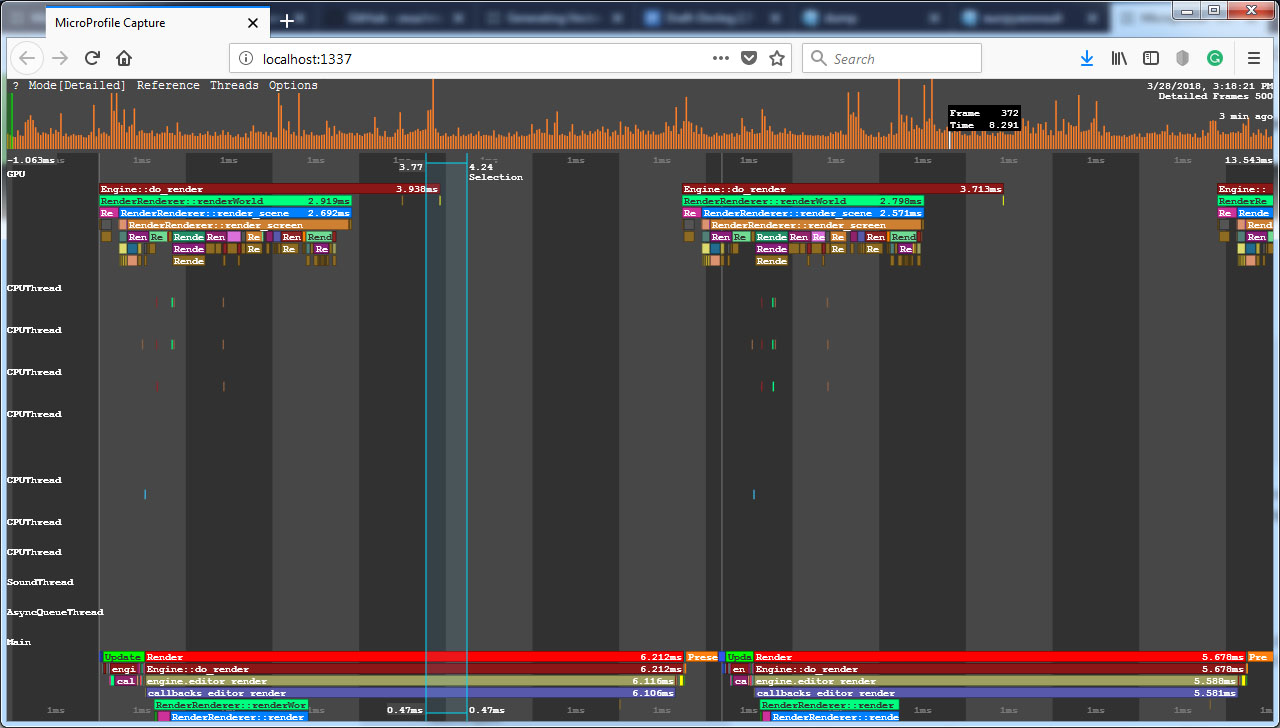
Microprofile can profile up to 1000 frames. It displays performance data on a local web server with the ability to save it as an HTML file.
The Microprofile tool is only available for Development builds of the engine: it is not compiled for Debug and Release builds.
You can check if Microprofile is enabled and turn it on using the microprofile_info console command. If it is disabled, you will need to change project settings in UNIGINE SDK Browser and restart the application:
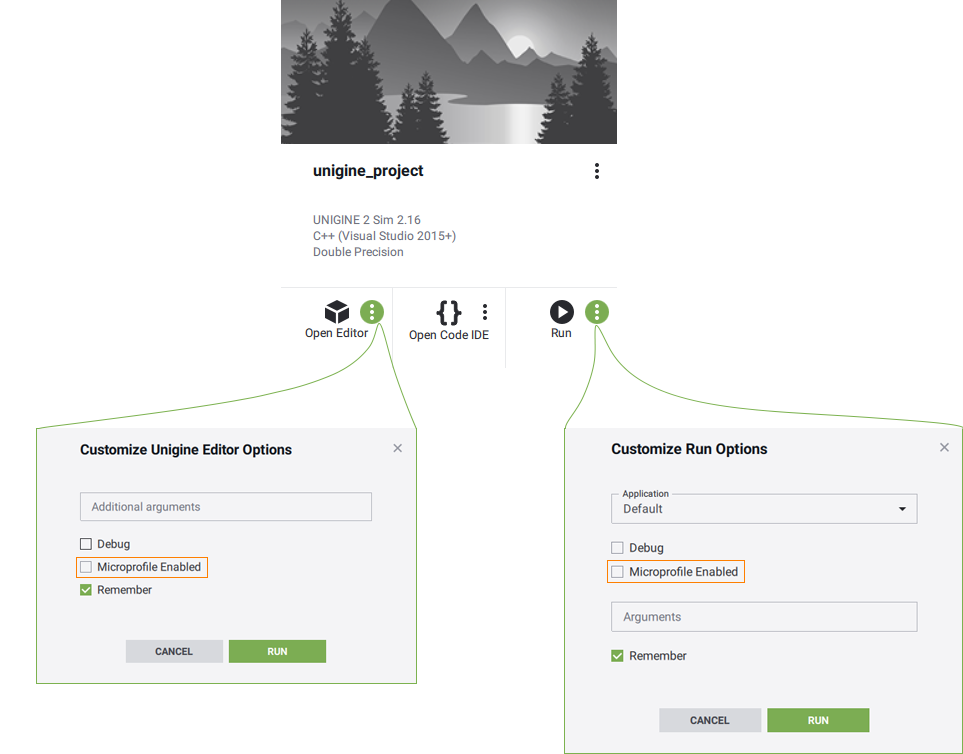
Microprofile should only be enabled when you are working with it. If you do not use performance profiling at a certain stage of working with your project, disable this tool.
Visualization Using Built-In Server#
The Microprofile tool has a web interface that displays performance data. To open the profiling results in a web browser select Tools → Microprofile in the UnigineEditor main menu. The default duration of the profiled segment is 200 frames, if necessary you can change the number of frames using the microprofile_webserver_frames console command.
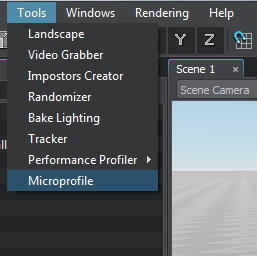
The performance data will be displayed in your web browser. Microprofile will be available via the link in the address bar while the application is running.
In the address bar, you can also limit the number of displayed frames using “/”: if you set localhost:1337/100, only the first 100 frames will be displayed.
Performance data#
Microprofile visualizes the detailed per frame performance data on operations performed by the engine on CPU and GPU and in the engine threads.
There are several modes for displaying performance data. You can switch between them in the Microprofile main menu: click Mode and select the desired one. The Detailed mode is set as a default one, as it provides the exhaustive information.
In this mode, the interface is divided into two parts:
- Main workspace that contains detailed information about each rendered frame. Each operation (function) and thread is displayed as a separate colored region. The regions are hierarchical: the function is a parent to the function that it calls and is displayed above it. The size of the region is determined by the time the corresponding operation takes. The workspace can be moved and scaled.
- Frame sequence that is used to easily navigate through the collected data. Each column is a frame. The column height corresponds to the frame rendering time. If you click on a column, you will quickly switch to the data collected on that frame. The last frames in the sequence provide the most valuable data for performance evaluation.

Performance data is displayed horizontally in several threads:
- GPU thread shows the call stack of the operations performed by the engine on GPU.
- Main engine thread show the call stack of the operations (such as update, rendering, etc.) performed on the CPU side.
- Other engine threads (CPUThread, SoundThread, AsyncQueueThread, WorldSpawnMeshClutterThread, WorldSpawnGrassThread).
Each frame starts from the update() function.
Profiling Custom Code#
You can use the Microprofile to inspect performance of your application logic.
Let's review a simple example. Suppose you have a C# component that moves a node in the scene and enables/disables it depending on its position in the current frame.
To find out how long it takes to execute such logic, you can use the Profiler class methods:
-
At the beginning of the Update() method call Profiler.Begin(). Specify the counter name that will be displayed in Micropofile as its argument. At the end of the method call Profiler.End().
Source code (C#)using System; using System.Collections; using System.Collections.Generic; using Unigine; #if UNIGINE_DOUBLE using Vec3 = Unigine.dvec3; using Vec4 = Unigine.dvec4; using Mat4 = Unigine.dmat4; #else using Vec3 = Unigine.vec3; using Vec4 = Unigine.vec4; using Mat4 = Unigine.mat4; #endif [Component(PropertyGuid = "8b5145d5832f5d30dea7cecf9991ede268b213d9")] public class NodeUpdate : Component { private void Update() { // start profiling Profiler.Begin("NodeUpdate Component"); float time = Game.Time; Vec3 pos = new Vec3(MathLib.Sin(time) * 2.0f, MathLib.Cos(time) * 2.0f, 0.0f); // change the enabled flag of the node node.Enabled = pos.x > 0.0f || pos.y > 0.0f; // change the node position node.WorldPosition = pos; // stop profiling Profiler.End(); } } -
Build and run the Release version of the project: open UnigineEditor, select Release in the Configuration field, and then click the Play button.
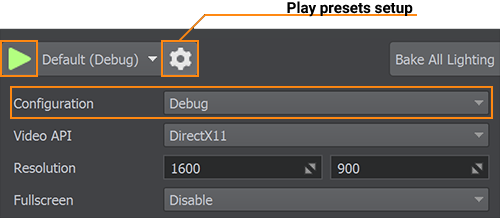
- Run the microprofile_enabled 1 console command, if Microprofiler hasn't been enabled via SDK Browser yet.
- Open Microprofile in the web browser.
-
Find the region with the name you passed to the Profiler.Begin() function. In our example that is "NodeUpdate Component".

The Profiler.Begin() and Profiler.End() functions make the code snippet available to both Profiler and Microprofile. If you want to use only Microprofile, use the Profiler.BeginMicro() and Profiler.EndMicro() functions. Note that their calls are different: Profiler.BeginMicro() returns an identifier to be passed to Profiler.EndMicro().
Source code (C#)private void Update() { // start profiling int id = Profiler.BeginMicro("Component Update"); float time = Game.Time; Vec3 pos = new Vec3(MathLib.Sin(time) * 2.0f, MathLib.Cos(time) * 2.0f, 0.0f); // change the enabled flag of the node node.Enabled = pos.x > 0.0f || pos.y > 0.0f; // change the node position node.WorldPosition = pos; // stop profiling Profiler.EndMicro(id); }
The information on this page is valid for UNIGINE 2.19 SDK.