Search the Community
Showing results for tags 'performance'.
-
UNIGINE 2.14.1 Community Windows 10, DX11 World::getIntersection method execution takes much longer than expected when entering relatively complex mesh bounding box. Create default C++ project named 'getIntersection_lag_on_collision' Get attached test project 'getIntersection_lag_on_collision' Merge Build Open editor to sync world data Run, notice lag-spike when nearly fell on the ground getIntersection_lag_on_collision.zip
-
Enabled / Disable auxiliary state performance.
sebastian.vesenmayer posted a topic in C++ Programming
Hello, we did observe that when we are changing the material of an ObjectMeshStatic, it will lose its auxiliary state information during runtime. We are using the aux buffer for outlining objects, but changing the material will disable the outlining. We did a workarround for this and did restoring the auxiliary state when the material changes. We did a profile run and did observe: restoring the auxiliary state takes always a lot of time until the function will return. So every time a material changes on an object the application halts for a noticeable time. Do you have a simple solution for that, that does not cost any extra ressources and time on CPU/GPU side? We are on 2.8 Unigine version using opengl. Thanks a lot. -
Cpu bottleneck in Unigine::Node::setTransform()
sebastian.vesenmayer posted a topic in C++ Programming
Hello, we are running into a cpu bottleneck while updating matrices via setTransform on nodes. We do have 50 instances with about 20 subtransformations for each node, which will be updated every frame. Is there a faster/better way to update positions/orientations. Version is 2.8 , renderer is directx. Thank you for your help.- 11 replies
-
- bottleneck
- node
-
(and 5 more)
Tagged with:
-
Hi, we are now integrating lights for our airport scenes. We tried to implement it with LightProj Objects and are generating very much of them (>300). They have no shadows enabled but can use much screen space. We enabled visibility distance but it looks very odd when moving over the airport and suddenly lights go on or off. I did some profiling and the worst case I approached was arround 20 ms on the gpu for the deferred light pass for 170 lights in the viewport. Are there any other possibilitys in the engine to bake lights for open world environments which don't use that much processing power? Since we are running 4K we want at least approach stable 30 fps. I appended the microprofile dump to this message. Thanks in advance. Sebastian MicroProfile Capture.html
-
Comparing Unigine Editor 2.8 performance with Unity and Unreal
morbid posted a topic in General Discussions
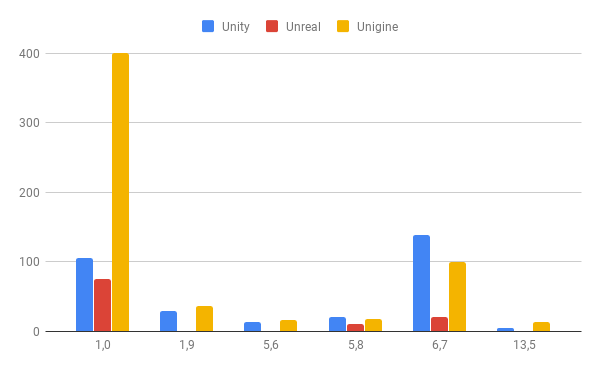
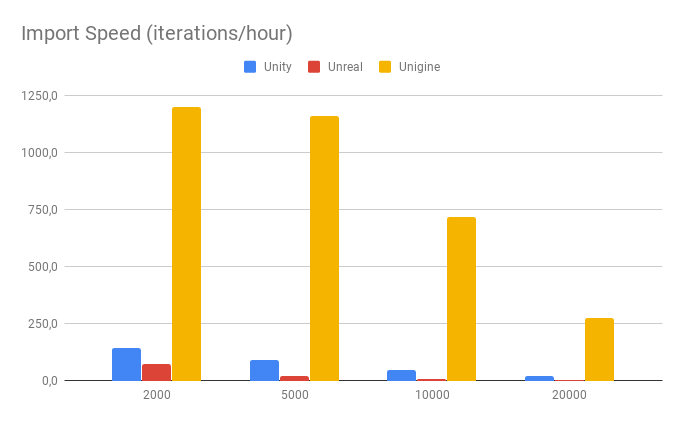
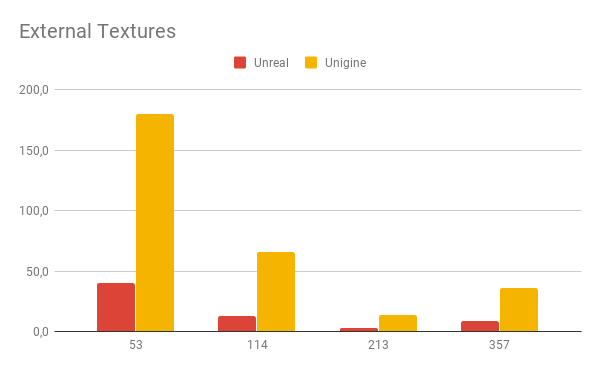
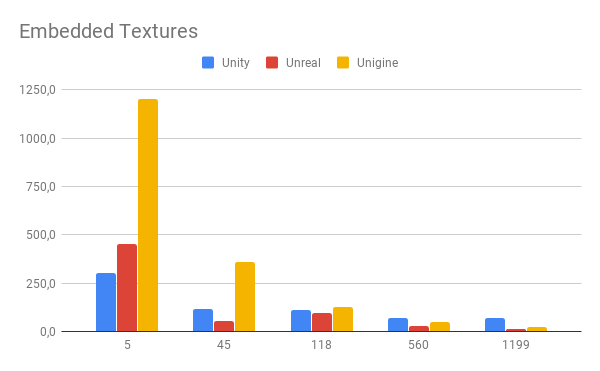
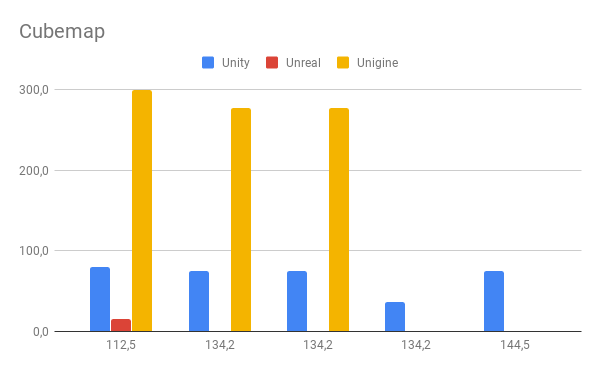
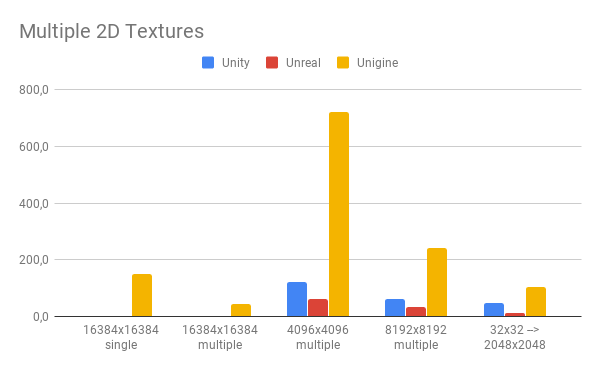
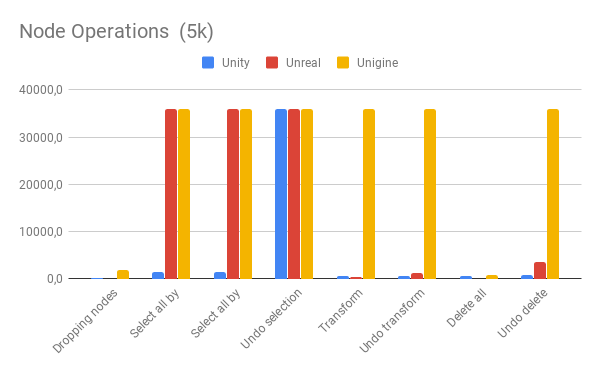
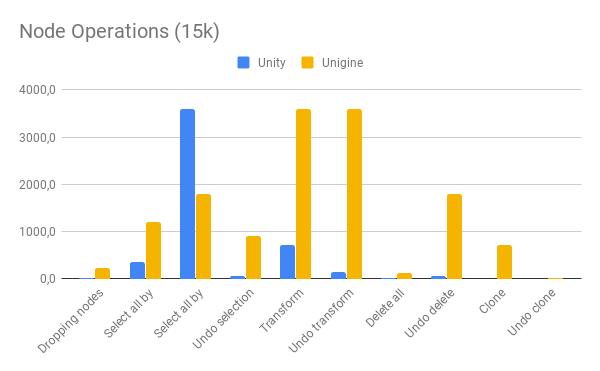
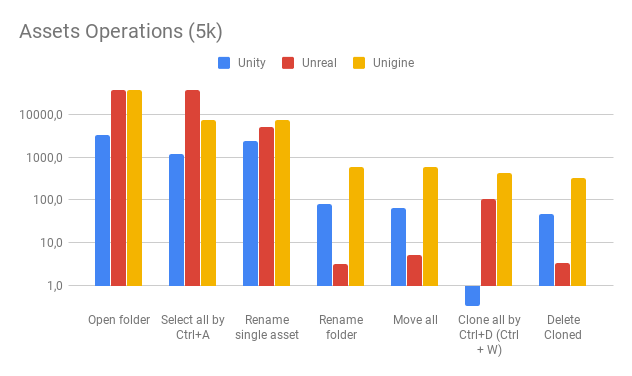
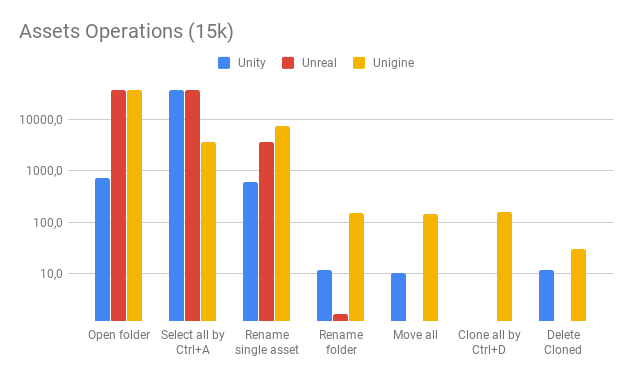
Why benchmarking Editor The less time you’re spending looking at progress bars the better experience you have, the faster you’ll move on with your tasks. Thanks to our customers we have collected a number of high load usage scenarios that helped us to improve overall performance of import, assets, and scene management subsystems. To understand how current Unigine Editor version performs we ran a number of tests inspired by real cases and compared results with some popular game engines. Test cases and methods We tested assets import, bulk nodes operations and asset systems. Detailed description of how the tests were run is provided in the corresponding parts of this article. Here will be described general principles we’d followed during the research: Every test was performed in the default Editors environment, no plugins attached, no settings changed. General criteria of a test completion is the equal result. For instance, some editors compress 8k textures to 2k by default, so we had to manually reconfigure import settings to get the identical 8k texture in every tested editor. If the test ended with an application crash or hang we nullified the result. All measurements were done multiple times to verify values. In order to make the tests closer to the real life, we used parts of the real projects from our customers and some complex enough test assets from open sources. All measures were done in seconds, then converted to the number iterations per hour. All graphs are built with iteration/hour value. Test rig We decided to use a somewhat typical development hardware: CPU: Core i5-9600K @ 3,7 GHz GPU: GTX 1080 - 430.64 RAM: 32 GB (4x8 GB Corsair Vengeance LPX @ 2133 MHz) MB: Gigabyte GA-B360M-DS3H Storage: Samsung 960 EVO SSD Software: All tests were run on Windows 10 Professional (build 17763.503). We used the following versions of the engines: UNIGINE Engine 2.8.0.1 Unity Engine 2019.1.2f1 Unreal Engine 4.22.1 Test 1. Geometry only import The first test files (FBX and OBJ) with polygon count varied from 1 to 13 millions, and number of meshes varied from 1 to 46 000+. It was hard to distinguish a straightforward conclusion due to a different editors behaviour in the performed tests. However, there are some things that can be stated: Unigine Editor loses performance with simple models with low number of stored objects (from 1 to a couple of dozen). We regain speed in extreme loads with thousands of objects in a single model. The more meshes are imported the higher delta of time spent on the process. You may notice that Unreal Editor’s results aren’t represented in all charts. This is happened due to a crash or insufficient RAM volume. The major inference here is that we have to reevaluate our approach to static geometry import, because that’s where the speed was bottlenecked. Iterations per hour and polygon count Test 2. Importing materials Here we checked how fast Unigine Editor handles import of thousands of materials. At first, we verified that the number of objects does not interfere with material import speed: fbx files with 5000 materials and different number of meshes were imported at the same speed in every tested application. The test files can be found here: Here we did our best: in every case Unigine Editor imports thousands of materials much faster than the other contestants. Iterations per hour and number of materials Test 3. Geometry and textures From synthetic test we moved to the more realistic use cases. FBX and OBJ files were divided into two groups: one with embedded textures and another with external textures. Polygon count varied from 100 000 to 10 M, textures number from 5 to 1 199. Most of the models were kindly provided by our customers, so they are representative for real projects, but we can't share them. However, there’s the Amazon Lumberyard Bistro (two OBJ files with external textures) which is Creative Commons (CC BY 4.0) licensed. Importing external textures made it difficult for Unity Editor. All tests were considered to be failed because only geometry with materials but not a single texture were imported. Iterations per hour and number of external textures Embedded textures were handled successfully by all of three tested editors. Unigine prevailed in 3 of the 5 cases, however, increasing the number of textures up to 1000 slowed import down. Iterations per hour and number of embedded textures Test 4. Importing cubemap textures This test was mostly focused on 16k Cubemap textures, but as exclusion we used one 15k texture. All textures were obtained from https://hdrihaven.com. Getting a usable 16k cubemap texture in Unigine Editor is almost 4 times faster than in Unity. Unreal dealt with 15k texture only, bigger resolution caused crashes. However, Unigine experienced issues with RGBA32F EXR and 17k RGB32F HDR textures. We’ll figure out why these files wasn’t processed. Iterations per hour and image megapixels Test 5. Importing 2D textures We used the range of textures from 32x32px to 16k. One test included 400 textures of different size and file format. All files were compressed from PNG, TGA, JPG to the runtime-ready format (DDS). The most noticeable breakaway seen with 4k textures: Unigine workflow brings up to 11 times faster asset processing. Iterations per hour and texture resolution Test 6. Nodes manipulation in Editor By nodes manipulation we mean a number of general tasks every user does in the scene editor: creating instances, cloning, transforming and undoing changes. We used two sets of nodes: 5k and 15k nodes in the scene. Every contestant editor managed with 5 000 of nodes in the scene. Unigine performed much better in the number of undo cases and node transformations. Iterations per hour and test cases Situation drastically changes with 15 000 of nodes. Unreal was dropped out because all cases resulted in hang or crash. We significantly lost in nodes selection, but still prevail in undo. Transform and creating duplicates. Iterations per hour and test cases Test 7. Assets manipulation in Editor Ideologically similar test was performed for the asset system. For the 5 000 assets minor Unigine’s drawback is selection time, while other operations are completed quite fast. Iterations per hour and test cases Increasing assets number respectively scales the required time for operation completion. Iterations per hour and test cases Final thoughts The work we’d done to the moment made Unigine Editor fast and reliable tool for 3D scene building. Of course, the tests showed us further optimization opportunities: massive selection, small meshes import and cubemap formats widening. The major spotlights of Unigine Editor are: Competitive content import system, fastest in a number of use cases Stable scene management under extreme load Effective and reliable workflow with big projects Please share your thoughts on UnigineEditor performance! -
Hi, I would like to ask you about performance for c++ vs c# solutions for heavy scenes. Do you have ones ? It is much difference ? Best, Jan
-
Hi, I'm running into some issues regarding performance difference between Editor and app run via the SDK browser. Running the VR emulator in the editor tells me i should be getting ~8ms per frame when emulating the Oculus Rift. (~4ms-5ms when not emulating) However when I run the profiler in the app after launching from the SDK browser, I'm getting 21ms per frame while wearing an Oculus Rift. (~4ms-5ms as before when the headset is not being worn.) What is causing this massive difference in performance? Is the emulator simply inaccurate?
- 3 replies
-
- oculus
- performance
-
(and 1 more)
Tagged with:
-
Hello, I observe frequent hiccups: a few frames long, maybe even a single frame that takes much longer than the allowable 16ms. This is with a basic terrain with a few buildings and trees, no custom code at all, and a machine dedicated to the IG (no antivirus, no firewall, no other application), and a nVidia Quadro P6000 with latest drivers. VSync is off, and the soft is runnning solo (no syncker), single screen. The hiccups seem to match terrain/object loading (just a feeling, I don't know how to check for that), and appear even when moving slowly. They don't happen if nothing moves, so they really are due to the engine, not from something outside. These hiccups are simply a show stopper for us. So what can I do to understand them, and then remove them completely ? Thanks.
-
How to prevent / stop world spatial from updating certain objects
kbrodie posted a topic in C++ Programming
Hello, I noticed that updating the world spatial takes a very long time (about 40 ms), and since it does this every frame, it sort of ruins my frame rate. The reason that world spatial takes so long is because it performs over 10000 (ten-thousand) calls to WorldSpatial::getIntersection. The high number of calls is related to the number of extra vehicles I have moving about in the world. With only 1 extra vehicle it only calls WorldSpatial::getIntersection a hundred times during an update. With 5 vehicles it's a 150, 10 vehicles sets it a 300, 20 vehicles at 900, you get the picture. Is there anyway to tell unigine to completely ignore during a world spatial update. We complete control the vehicles in the software (from where there going to where they appear). We only need Unigine to draw the vehicles and let us do the rest. The vehicles consists out of several nodes (body, interior, lights and wheels) and a physical trigger (box), that we use for colision detection. I tried to set the spatial property (node->setSpatial) to 0, but that didn't do anything. Any help would be appriaciated. Kind regards, Kai P.s.: I'm using Unigine 2.3. -
Hi, We're running Unigine as a simulation where we drive our trains from one point in the world to another. The simulation run can potentially be in the order of 50km in distance. Between simulation runs, we typically leave Unigine instance running (but unload the world between runs). One thing that we have observed with regular frequency is that the performance on the first run after starting Unigine can be quite poor. We see frame rate drops, stutters, it could be due to a number of factors, loading from disk (we are using SSD) , texture/mesh upload to the card. However, on subsequent simulation runs (that start from the same location in the world), the performance is far smoother. The poor performance occurs in different spots in the scene each time so its not like we can characterise with content. We have also optimised our content fairly agressively to reduce the number of draw calls. I certainly don't think our problem is hardware related - we're running an I7-4970K with 32GB RAM and a triple SLI 780ti configuration (these problems aren't related to microstutter since we see the same problems on our single Titan box) So to me it seems that the first simulation run, some sort of caching is being done under the hood which results in subsequent simulation runs being smoother. So I'm wondering are there any explicit API calls that we can look into to explicitly control the caching/file/resource loading so that our performance is smoother. I understand by my somewhat vague description here that you wont be able to completely characterise the problem but I'm wondering if anyone has any hints on what configuration settings or API calls we should be looking at to explicitly control the loading of caching of resources. thanks Craig
-
So I compiled a stress test of Unigine's instancing/rendering capabilities, and my results are pretty strange. I'm hoping someone can explain why I'm getting these numbers. All tests are performed in a new scene, with only the profiler and toolbar visible. The object I'm using has 452 triangles and the default mesh-base material with one diffuse texture. All post-processing effects are off. Machine specs: Intel i7 CPU, 2.8 GHz Nvidia GeForce GTS 250 8 GB RAM 1920x1080 resolution 1. Everything disabled, blank screen FPS: 700 Draw Calls: 2 Shaders: 3 Triangles: 2 Materials: 2 2. A single object, no light FPS: 535 Draw Calls: 4 Shaders: 5 Triangles: 906 over 2x original triangle count Materials: 4 3. Two identical objects, same materials, no light FPS: 500 Draw Calls: 4 Shaders: 5 Triangles: 1810 about 4x original triangle count Materials: 4 4. 2 identical objects, world light enabled FPS: 480 Draw Calls: 7 Shaders: 8 Triangles: 4070 4.5x original triangle count Materials: 5 5. 10 identical objects, world light enabled FPS: 452 Draw Calls: 8 +1 Shaders: 8 Triangles: 19438 4.3x original triangle count Materials: 5 6. 50 identical objects, world light enabled FPS: 407 Draw Calls: 10 +2 Shaders: 7 -1? wtf? Triangles: 90402 4x original triangle count Materials: 5 7. 200 identical objects, world light enabled FPS: 145 Draw Calls: 56 +46! Shaders: 8 Triangles: 738570 over 8x original triangle count Materials: 5 8. 800 identical objects, world light enabled FPS: 57 Draw Calls: 204 +148! Shaders: 8 Triangles: 2912238 still 8x original triangle count Materials: 5 9. 3200 identical objects, world light enabled FPS: 19 Draw Calls: 602 +398! Shaders: 6 -2? Wtf? Triangles: 8678402 6x original triangle count Materials: 5 10. 3200 identical objects, world light DISABLED FPS: 27 Draw Calls: 402 Shaders: 5 Triangles: 5785602 4x original triangle count Materials: 4 The triangle and draw call counts are all over the place. I have some questions about this. Why do the profiler's triangle counts never match the object's tri count? Is it counting the triangles rendered in each pass? And if that's the case, why do the numbers still never match up evenly? There are tests where the triangle count is over 8 times what it should be! I performed this test with static meshes, because I've read that the batching in Unigine is done automatically, and the first couple cloning tests support that theory. So why do the draw calls increase? If these objects were truly instanced, shouldn't the engine draw them all in one call? And the draw call/poly increase never matches up with the rate at which I'm duplicating objects. Why does the directional light dramatically increase the triangle count? Why are there changes in shader count? I was also seeing some very strange behavior when copying objects. When getting up to the higher numbers where the numbers start to stray, I noticed a huge spike in the tri count when I copied objects, and watched it lower based on how near in world space the clone was to the original. I also saw the triangle count change based on where the objects were on the screen, and how far away the camera was. These objects didn't have any lod assigned, why would this change?
- 9 replies
-
- performance
- stress test
-
(and 3 more)
Tagged with:
-
Hi, I've checked the heaven demo (demos/heaven_d3d11.bat) in different modes (Window and full-screen) and would like to share some screenshots with performance graphs. Window mode 1980x1200: Performance window: Full screen 1980x1200: Performance window: The question is why does Unigine perform better in the window mode than in full-screen mode? Best regards, Sergey Shandar.
- 5 replies
-
- performance
- window
-
(and 1 more)
Tagged with:


