Performance Profiler
A performance profiler displays performance data in a timeline. It reports how much time is spent per each frame for updating all aspects of your project: rendering nodes that are in view, updating their states, executing scripts with game logic, calculating physics, etc.
With the profiler, you can:
- Detect the bottlenecks of your application
- Check if art assets optimization is required
- Check if code optimization is required
- Compare the profiling results before and after the changes
Activate Profilers#
To turn the profiler on, click Tools -> Performance Profiler and choose the required profiling mode:
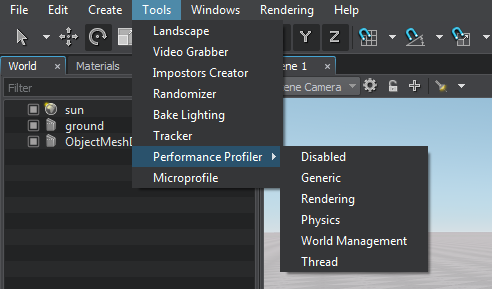
The following profiling modes are available:
- Generic profiler shows only the general statistics block.
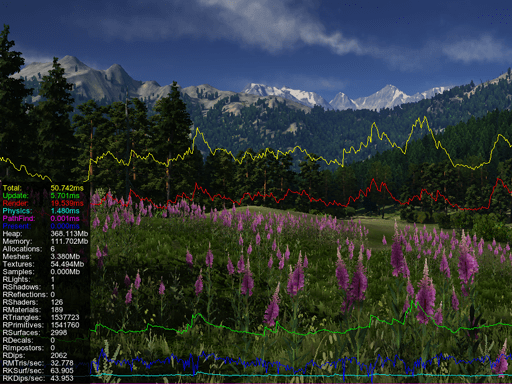
- Rendering profiler shows the detailed rendering statistics and the timeline chart.
- Physics profiler shows the detailed physics-related statistics (within the Physics radius) and the timeline chart.
- World Management profiler shows the statistics on the whole loaded world.
- Thread profiler shows the statistics on loading threaded resources.
To show profiler statistics in the in-game mode type show_profiler command and a value from 1 to 5 in the console. To disable the profiler in the in-game mode, type show_profiler 0 in the console.
Generic Profiler#
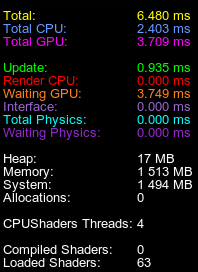
| Total | Total time in milliseconds taken to both calculate and render the current frame. This is the duration of the main loop in the application execution sequence.
Total = Total CPU + Waiting GPU |
|---|---|
| Total CPU | Total time in milliseconds taken to prepare the current frame (including update, render, and swap). |
| Total GPU | Total time in milliseconds taken to render the current frame on the GPU. Notice
This counter may not work on some GPUs. |
| Update | Time taken to update application logic. This includes executing all steps in the update() function of the world script. It also includes the update of states of all nodes (for example, update of the skinned animation or of a particle system to spawn new particles).
|
| Render CPU | Time taken to prepare all data to be rendered in the current frame and feed rendering commands from the CPU to the GPU. If Render CPU time is too high, it signals that art assets may need to be optimized, for example:
|
| Waiting GPU | Time between completing all calculations on the CPU up to the moment when the GPU has finished rendering the frame. (See the illustration). This counter is useful to analyze the bottleneck in your application's performance.
|
| Interface | Time taken to render all GUI widgets. |
| Total Physics | Time taken to perform all physics calculations. |
| Waiting Physics | Time period during which the physics module waits for the completion of rendering process to return to the Main thread and execute the rest of the physics ticks. |
| Heap | Size of all memory pools allocated for the application. Unigine allocator allocates memory in pools which allows the allocation to be faster and more efficient (if USE_MEMORY directive is used, by default). As the memory is allocated in pools, the counter value increases stepwise. |
| Memory | Size of all memory blocks allocated on demand. This counter reports how much memory in allocated pools application's resources really use.
|
| System | Size of RAM memory used for the application. |
| Allocations | Number of allocation calls during the frame. (This counter reports an allocation call even if several bytes are requested to be allocated). |
| CPUShaders Threads | Number of internal engine threads used for CPU shaders. |
| Compiled Shaders | Number of shaders that are currently compiled. |
| Loaded Shaders | Number of shaders loaded to RAM. |
Rendering Profiler#
The following statistics are displayed in addition to the generic one:
| RAM Sounds | Memory (RAM) amount currently used for sound samples, in megabytes. |
|---|---|
| RAM Terrain | Memory (RAM) amount currently used for terrain streaming, and the memory limit set for it, in megabytes. The memory limit is the maximum amount of RAM that can be used for terrain streaming. |
| RAM Meshes Static | Amount of RAM currently used for streaming static meshes, and the memory limit set for it, in megabytes. The memory limit is the maximum amount of RAM that can be used for streaming static meshes.
Notice
The same static mesh will use more RAM than VRAM, as additional data is generated in RAM to calculate collisions, intersections, spatial trees and so on. |
| VRAM Terrain Cache | Amount of VRAM cache currently used for Landscape Terrain tiles, in megabytes. |
| VRAM Terrain Virtual Texture | Amount of VRAM currently used for the Landscape Terrain virtual texture, in megabytes. |
| VRAM Terrain Detail Textures | Amount of VRAM currently used for Landscape Terrain details, in megabytes. |
| VRAM Meshes Static | Amount of VRAM currently used for streaming static meshes, and the VRAM limit set for it, in megabytes. The VRAM limit is the maximum amount of VRAM that can be used for streaming static meshes. |
| VRAM Meshes Skinned | Amount of VRAM currently used for skinned meshes, and the VRAM limit set for it, in megabytes. The VRAM limit is the maximum amount of VRAM that can be used for skinned meshes. |
| VRAM Textures | Amount of VRAM currently used for textures, and the maximum amount of VRAM that can be used for them, in megabytes. |
| VRAM Textures Cache | Amount of VRAM currently used for textures cache, in megabytes. |
| VRAM Render Buffers | Amount of VRAM currently used for rendering buffers (Gbuffer, post-effects, etc.), in megabytes. |
| VRAM Particles | Amount of VRAM currently used for vertices of particle systems, and the maximum amount of VRAM that can be used for them, in megabytes. |
| Async Buffer | Memory amount currently used for the async buffer, in megabytes. Intermediate buffer to which resources are asynchronously loaded during the streaming process. Notice Available for OpenGL only. |
| Async Buffer Indices | Memory amount currently used for mesh indices buffer, in megabytes. This buffer is used to store indices of meshes asynchronously loaded during the streaming process. Notice Available for OpenGL only. |
| VRAM Total | The total VRAM amount that is currently used. |
| Terrain Reload Tiles | Number of Landscape Terrain tiles that are currently awaiting reloading after being modified. |
| Terrain Reload Bounds | Number of events causing reloading of tiles (one bound may cause reloading of multiple tiles). |
| Dynamic Reflections | The number of dynamic reflections drawn per frame. In case of cubemap reflections, if all six faces are updated, six reflections are rendered each frame. |
| Lights | Number of light passes rendered per frame. This means that the counter displays the number of all light sources that are currently seen illuminating something in the viewport. This value also includes additional passes for rendering lights in the reflecting surfaces (if dynamical reflections are used). Plain 2D reflection will multiply the number of rendering passes by two, while cubemap-based reflection with six faces updated each frame will multiply the number of rendering passes by six.
Notice
Each light redraws mesh polygons it illuminates. That is why the higher the number of light sources, the higher the number of polygons the graphics card has to render, and the lower the performance. For example, using two omni lights will as much as double the rendered geometry they shine on. |
| Shadows | Number of shadow passes rendered per frame. Each light requires a shadow pass to calculate the shadows. Again, if there are reflecting surfaces with shadows drawn reflected, this will increase the number of shadow passes. |
| Decals |
Number of decals rendered per frame (in all rendering passes). If a decal has any additional effect (is transparent, emits light, lit by a light source, or has any other visual effect) that involves an additional rendering pass for this decal, this decal will be rendered additionally in every corresponding pass, thus the total number of rendered decals will increase. |
| Surfaces |
Number of surfaces rendered per frame (in all rendering passes). If a surface has any additional effect (is transparent, emits light, lit by a light source, or has any other visual effect) that involves an additional rendering pass for this surface, this surface will be rendered additionally in every corresponding pass, thus the total number of rendered surfaces will increase. |
| Triangles All | Total number of triangles rendered per frame including all polygons that are currently visible in the viewport as well as the ones rendered in the process of shadows rendering. |
| Triangles Shadows | Number of triangles rendered per frame in the process of shadows rendering. Each light source has to redraw the geometry it illuminates, increasing the overall count of rendered triangles. In order to avoid GPU bottleneck, keep the number of dynamic light sources and their radius as low, as possible. |
| Triangles Viewport | Number of triangles rendered per frame. This includes all polygons that are currently visible in the viewport (geometry). |
| Primitives | Number of geometric primitives rendered per frame. This includes points, lines, triangles, and polygons. The visualizer and the profiler itself also add to this counter. The value differs dramatically if tessellation is used. In this case, Triangles reports the number of triangles in the coarse mesh, while Primitives shows statistics on the number of tessellated primitives. |
| Dips | The number of draw calls. The higher the number of identical mesh surfaces with the same material, the more effective the instancing is (enabled by default). This means, the number of draw calls is minimized offloading both the CPU and the GPU.
You can compare the number of surfaces ( Surfaces) and the number of DIPs used to render them. For example, if there are 30000 surfaces and 1000 DIPs, it means that 30 instanced surfaces of meshes are rendered per only one draw call (Surfaces/Dips). Thus the instancing provides performance boost. |
| Materials | Number of materials set per frame. (Materials are set in each of the rendering passes.) |
| Shaders | Number of shaders set per frame. (Shaders are set in each of the rendering passes; hence if only one material used, its shader still needs to be set several times. When nothing is visible and the screen is black, even in this case the composite shader is still used.) |
| Compile Shaders | Number of shaders compiled during the frame. |
Physics Profiler#
This profiler shows statistics within the Physics radius.
The following statistics are displayed in addition to the generic one:
| PIslands | Number of physical islands within the physics radius that could be calculated separately. The lower this number, the less efficient multi-threading is. |
|---|---|
| PBodies | Number of bodies within the physics radius. |
| PJoints | Number of joints within the physics radius. |
| PContacts | Total number of contacts within the physics radius; this includes contacts between the bodies (their shapes) and body-mesh contacts. |
| PCollision | Duration of the collision detection phase of physic simulation when collisions between objects are found. |
| PSimulation | Duration of all simulation phases added together. |
Watch an overview of the Physics Profiler options in our video tutorial on physics.
World Management Profiler#
This profiler shows statistics on the whole world.
The following statistics is displayed in addition to the generic one:
| WNodes | Total number of nodes in the world (both enabled and disabled). |
|---|---|
| WBodies | Total number of bodies in the world. |
| WShapes | Total number of shapes in the world. |
| WJoints | Total number of joints in the world. |
| WSpawn | Time in milliseconds that the engine spends on generating content in procedural nodes (such as grass, clutters, world layers). |
Thread Profiler#
The following statistics are displayed in addition to the generic one:
| AsyncQueue | Time of asynchronous loading of resources (files/meshes/images/nodes), in milliseconds. |
|---|---|
| Sound | Time of asynchronous loading of sounds, in milliseconds. |
| PathFind | Time of asynchronous pathfinding calculations, in milliseconds. |