Content Profiler
Big projects with a huge number of assets have to face the optimization stage to improve performance and have acceptable FPS. An overview of the project's bottlenecks is given by Performance Profiler. However, memory consumption displayed there is just a figure, and optimization activities need more details.
To clearly understand which assets can be optimized or deleted, Content Profiler is used. Using this tool, you can manage textures and surfaces:
- See how much memory every texture and surface used in the project takes.
- Quickly view the most consuming textures and surfaces and easily find them in Asset Browser and World Hierarchy.
- Check the texture resolution and sort textures by memory size.
Content profiler visualizes the content (textures or surfaces) the size that each item takes in the video memory. The content visible in the viewport is assessed. Hovering above the item in the box representation allows previewing it, clicking on the box opens the item in Asset Browser and World Hierarchy.
Opening Content Profiler#
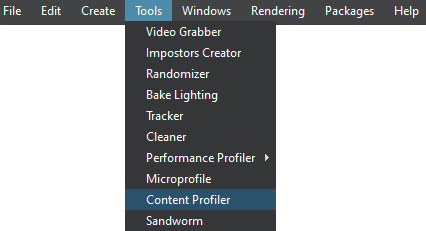
To open the Content Profiler window, choose Tools -> Content Profiler on the Menu Bar of UnigineEditor.
The Content Profiler window will open.

It has two tabs: one allows managing textures, the other — surfaces.
The info is displayed upon clicking the Refresh button. The content visible in the viewport and available in video memory will be analyzed.
An item selected in one tab is highlighted in the other tab and shown in UNIGINE Editor.
Multi-selection is available.