内容分析器
 Big projects with a huge number of assets have to face the optimization stage to improve performance and have acceptable FPS. An overview of the project's bottlenecks is given by Performance Profiler. However, memory consumption displayed there is just a figure, and optimization activities need more details.拥有大量资源的大型项目必须面对优化阶段,以提高性能并获得可接受的FPS。Performance Profiler给出了项目瓶颈的概述。但是,这里显示的内存消耗只是一个数字,优化活动需要更多的细节。
To clearly understand which assets can be optimized or deleted, Content Profiler is used. Using this tool, you can manage textures and surfaces:为了清楚地了解哪些资源可以优化或删除,使用了Content Profiler。使用这个工具,你可以管理纹理和曲面:
- See how much memory every texture and surface used in the project takes.看看项目中使用的每个纹理和曲面占用了多少内存。
- Quickly view the most consuming textures and surfaces and easily find them in Asset Browser and World Hierarchy.快速查看最消耗的纹理和曲面,并轻松地在资源浏览器和世界层次结构中找到它们。
- Check the texture resolution and sort textures by memory size.检查纹理分辨率并根据内存大小对纹理进行排序。
Content profiler visualizes the content (textures or surfaces) the size that each item takes in the video memory. The content visible in the viewport is assessed. Hovering above the item in the box representation allows previewing it, clicking on the box opens the item in Asset Browser and World Hierarchy.内容分析器可视化内容(纹理或曲面),每个项目在视频内存中占用的大小。评估视口中可见的内容。将鼠标悬停在框表示中的项目上方可以预览它,单击该框将在资源浏览器和世界层次结构中打开该项目。
Opening Content Profiler开放内容分析器#
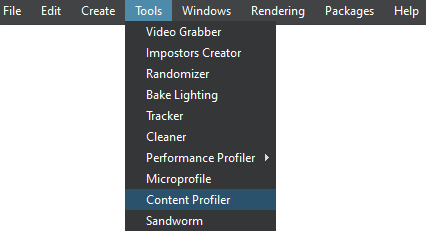
To open the Content Profiler window, choose Tools -> Content Profiler on the Menu Bar of UnigineEditor.要打开内容分析器窗口,请在UnigineEditor的菜单栏上选择Tools -> Content Profiler。
The Content Profiler window will open.“内容分析器”窗口将打开。

It has two tabs: one allows managing textures, the other — surfaces.它有两个选项卡:一个允许管理纹理,另一个,曲面。
The info is displayed upon clicking the Refresh button. The content visible in the viewport and available in video memory will be analyzed.单击Refresh按钮时显示该信息。在视口中可见的内容和在显存中可用的内容将被分析。
An item selected in one tab is highlighted in the other tab and shown in UNIGINE Editor.在一个选项卡中选中的项目在另一个选项卡中突出显示,并显示在UNIGINE Editor中。
Multi-selection is available.可进行多种选择。
Surface profiling is available for development builds only.曲面分析仅用于开发构建。